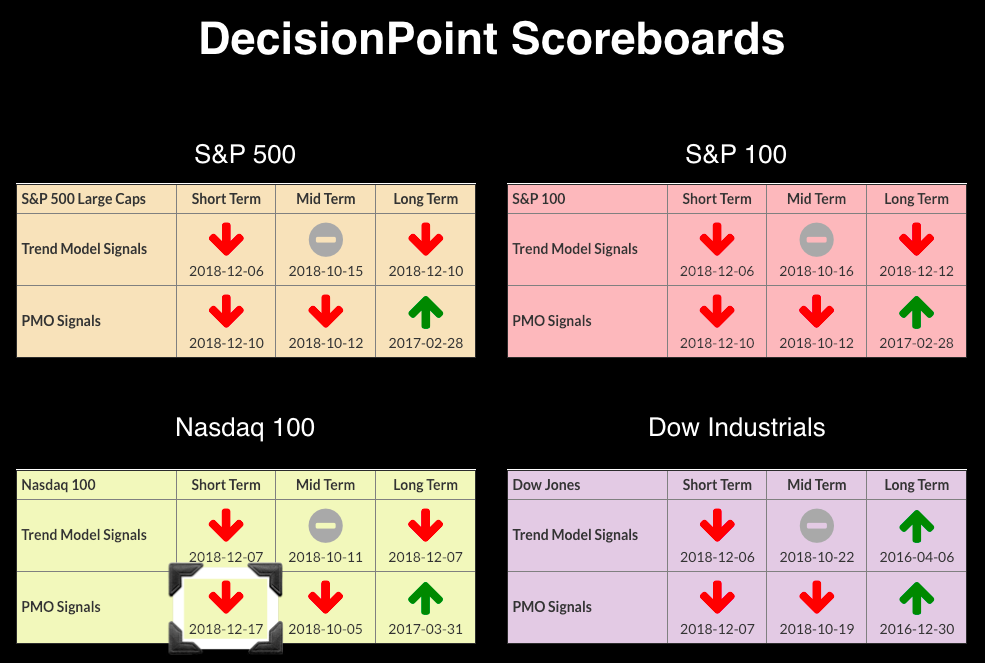
 You might be chuckling at the title which pays homage to the Rankin/Bass stop-motion animated classic A Year Without a Santa Claus. In the show, it takes two elves, a little boy and a young reindeer to prove to a despondent Santa that everyone does indeed misses him and believe. Santa, of course, hopped right into his sleigh and took off. I thought maybe the FOMC would try to coax "Santa" out of hiding, but in a "humbug" move, it affirmed to the market that it was not planning on slowing down its rate hikes in the near future. Thus it appears that the market will be getting coal for Christmas in the form of more decline. (Although a look at $DJUSCL, the Coal Index, it wouldn't be a terrible present if Coal can break out of its trading range). The Scoreboards are still quite negative and getting worse as the NDX added a PMO SELL signal. The Dow is just about ready to lose its Long-Term Trend Model BUY signal, which triggered all the way back in April 2016.
The DecisionPoint Alert presents a mid-week assessment of the trend and condition of the stock market (S&P 500), the U.S. Dollar, Gold, Crude Oil and Bonds.
SECTORS
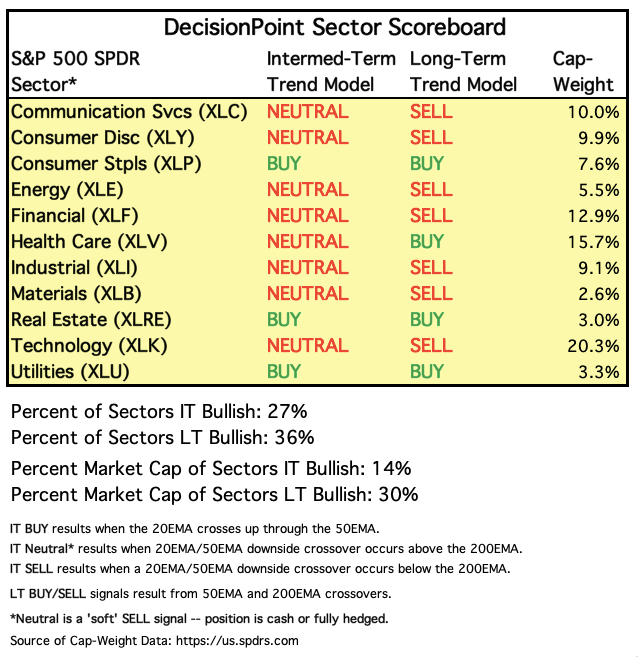
Each S&P 500 Index component stock is assigned to one, and only one, of 11 major sectors. This is a snapshot of the Intermediate-Term and Long-Term Trend Model signal status for those sectors.
STOCKS
IT Trend Model: Neutral as of 10/15/2018
LT Trend Model: SELL as of 12/10/2018
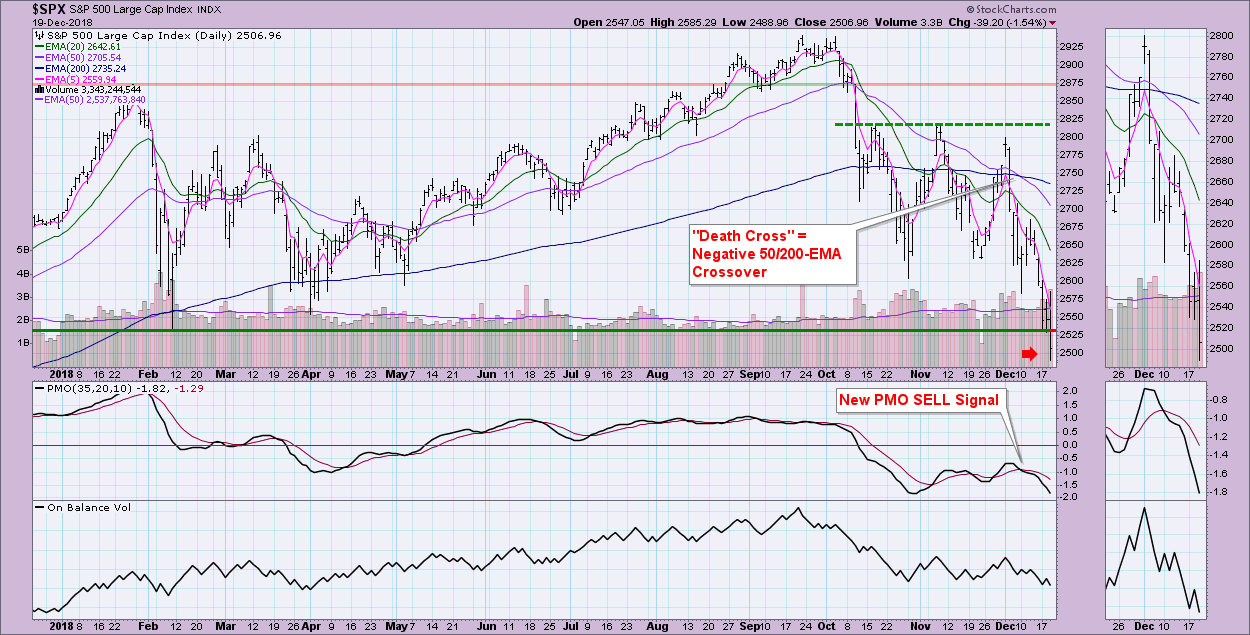
SPX Daily Chart: A very important support was broken today at 2500, but the market did manage to close just above it. That's about the only bright spot on this chart.
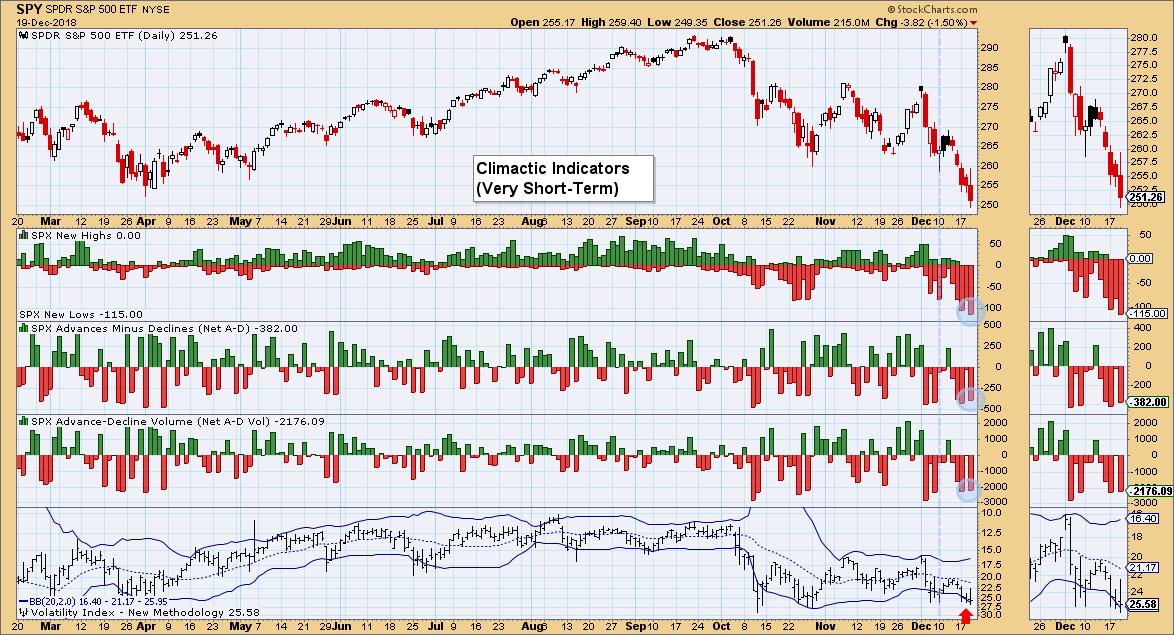
Ultra-Short-Term Market Indicators: We saw highly climactic readings to the downside. When I get these readings, I must determine if it is selling exhaustion or initiation. Based on the position of the VIX below its Bollinger Bands and the previous week of decline, it smells like exhaustion. We could see a rally pop tomorrow or Friday, but it could be, much like today, a rally on the open and then a crash lower... so don't get too excited.
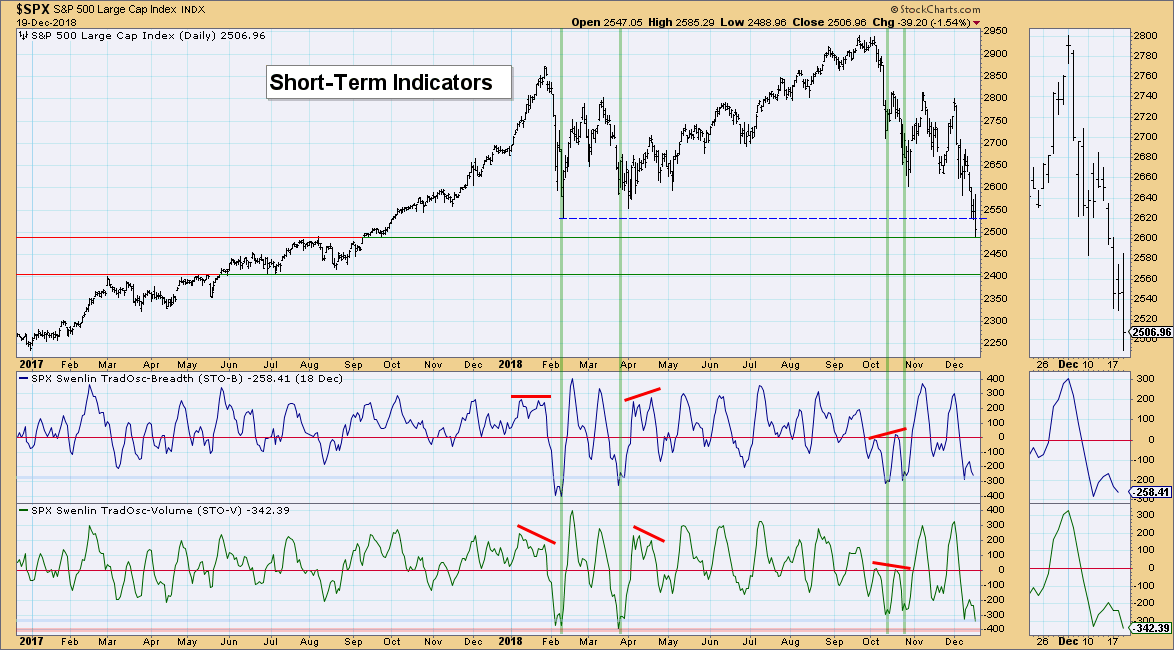
Short-Term Market Indicators: These indicators made a quick turnaround after it appeared they were ready to make a run back up to the zero line. Now, they are both very oversold. Typically, this implies an upcoming rally, but I suspect we are looking at the same situation we had in March, more volatility and mostly downside action.
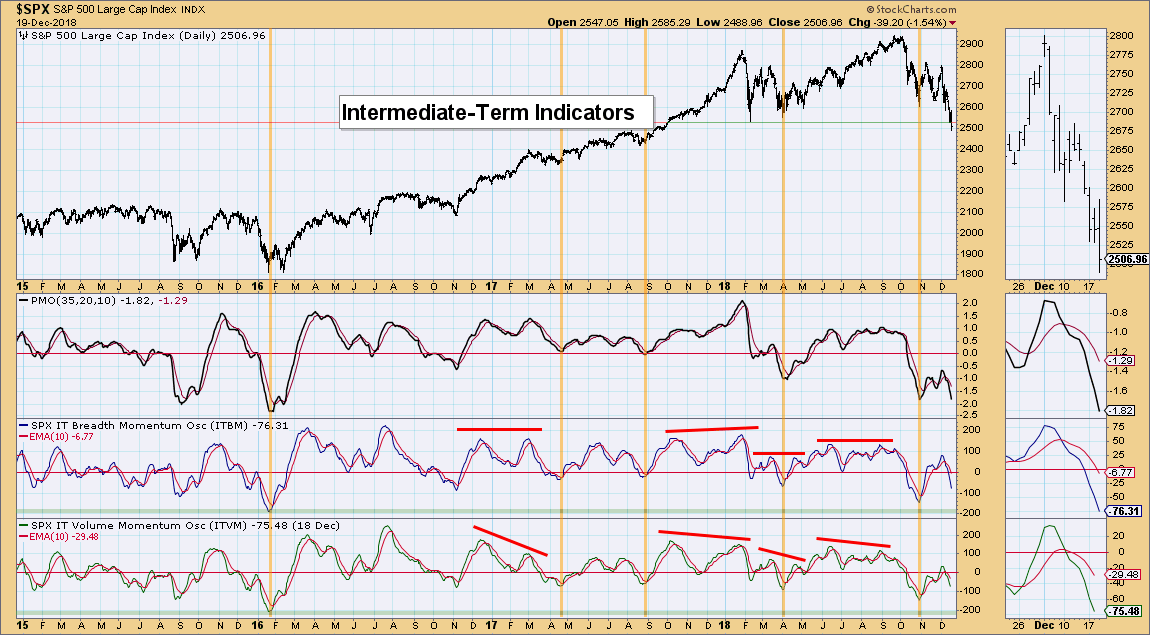
Intermediate-Term Market Indicators: These indicators are quite worrisome. They are declining bearishly (not a surprise), but they haven't been racing lower. Consequently, they aren't oversold. They can move lower and I suspect they will, taking the market along with them.
Conclusion: Some have called me a "perma-bull," an analyst with a bullish bias. As one person emailed me, when you and Carl both start talking bear market, it's time to listen. I don't know about that, but I can tell you that I don't see much for the bulls to hang a hat on. If you get nothing else from this blog, I hope you get this... Remember: It's time to follow "bear market rules." We shouldn't expect oversold conditions to result in a big rally. As Carl says, it is more like "thin ice" - possible to walk on, but difficult to bounce off from.
DOLLAR (UUP)
IT Trend Model: BUY as of 4/24/2018
LT Trend Model: BUY as of 5/25/2018
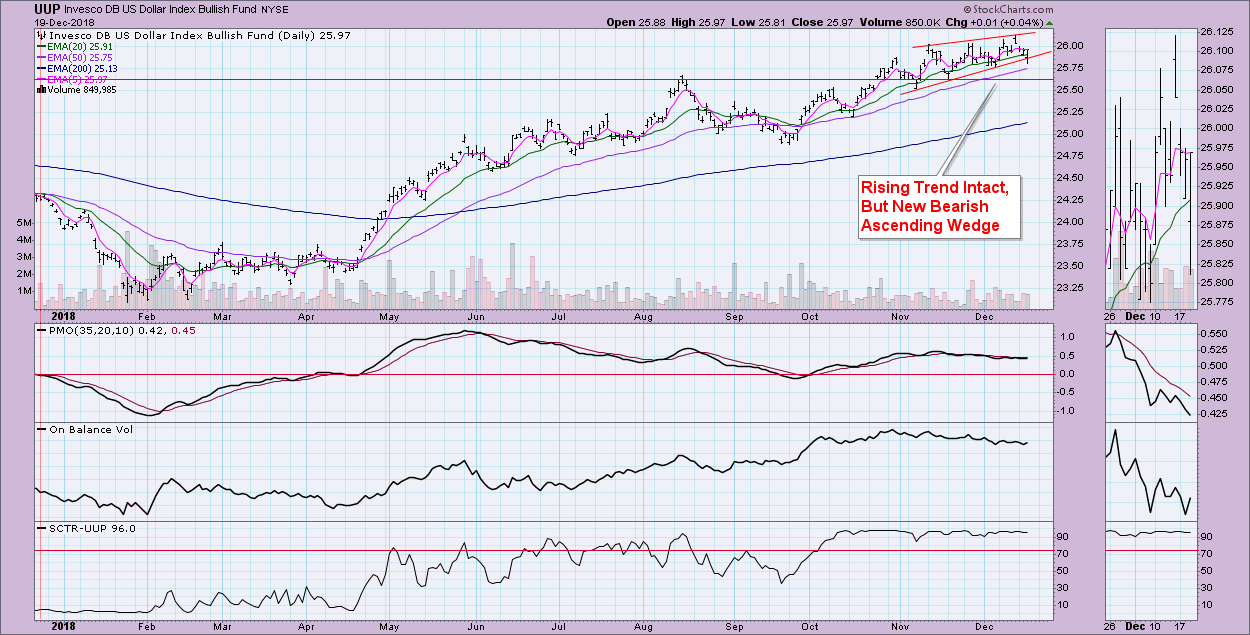
UUP Daily Chart: The Dollar remains in a bullish rising trend, but it has now formed a bearish rising wedge. The PMO has failed yet again to get above its signal line. Although the SCTR is still strong, I'd pay more attention to the PMO and chart pattern. If it executes, the minimum downside target would be $25.25.
GOLD
IT Trend Model: BUY as of 10/19/2018
LT Trend Model: SELL as of 6/22/2018
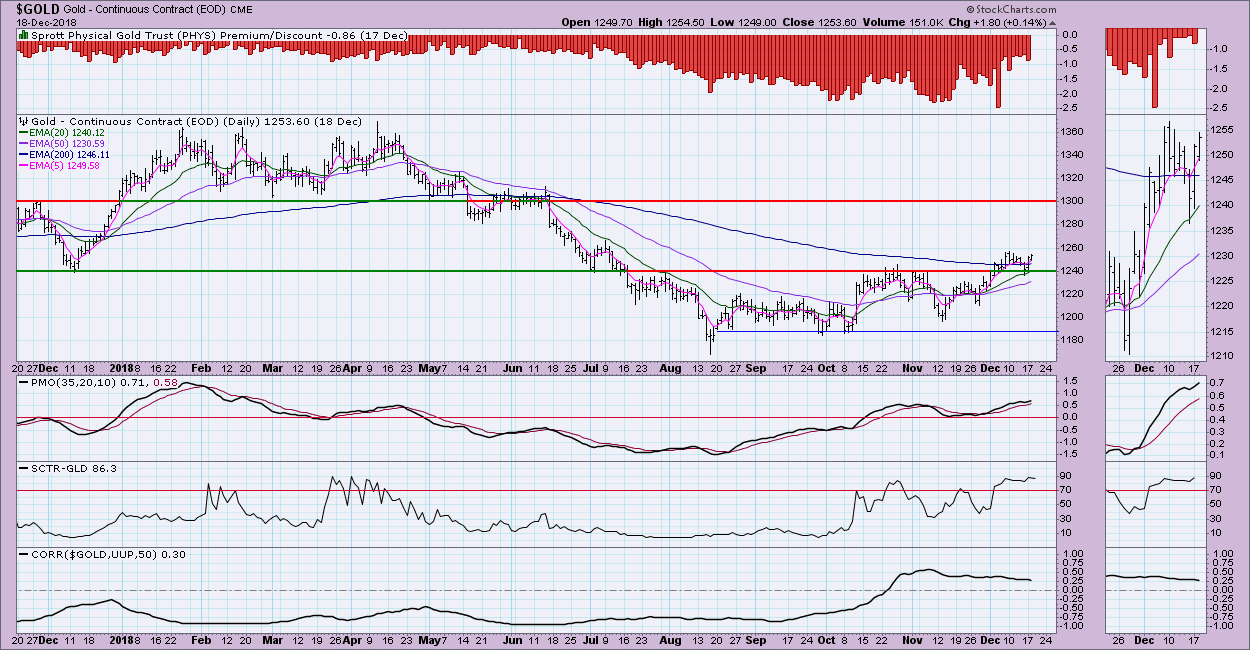
GOLD Daily Chart: The positive correlation between Gold and the Dollar is easing - they aren't even really correlated right now. That's good news for Gold. I expect to see Gold, along with metals in general, to make a move should we continue lower in equities. This is often considered a safe haven. I know I'm looking very closely at metals to move part of my long-term holdings into. All indicators are looking good, minus bearish sentiment. Discount rates are low, but while it shows bearish sentiment, it could certainly use more.
CRUDE OIL (USO)
IT Trend Model: Neutral as of 10/29/2018
LT Trend Model: SELL as of 11/23/2018
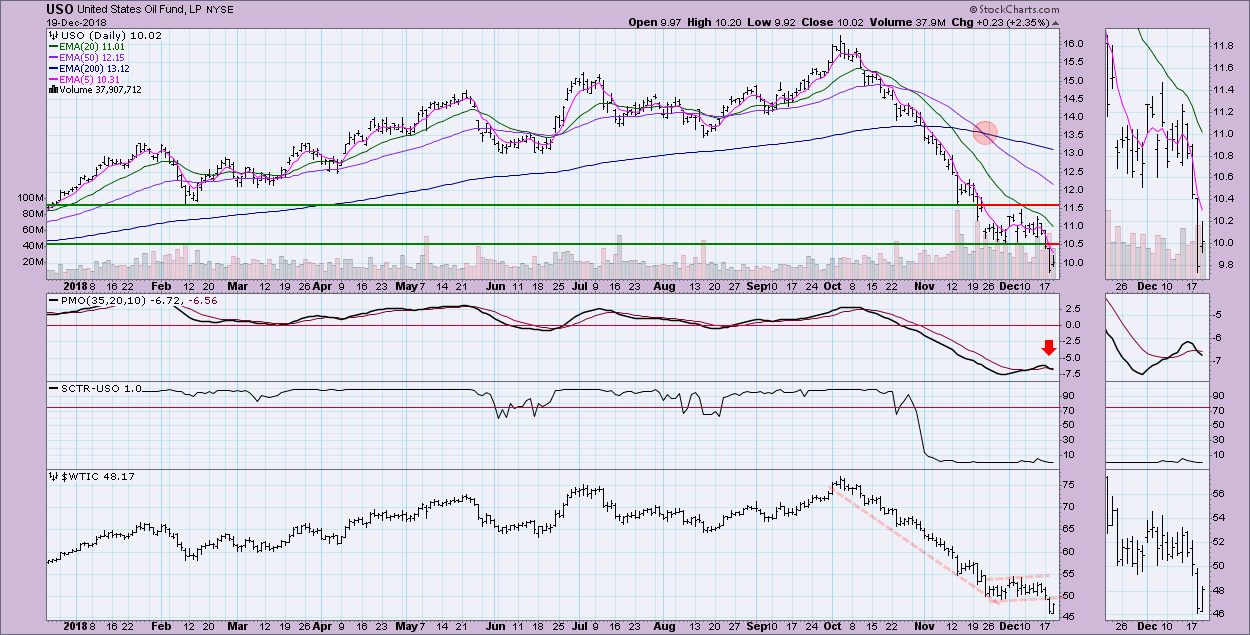
USO Daily Chart: Reverse flags on USO and $WTIC have both executed. Given the length of the flag poles, the downside possibilities are very serious. If you use textbook measurements on USO, the minimum downside target would be $5.00. I don't see it losing half its value, but it certainly doesn't look like it's ready to bottom.
BONDS (TLT)
IT Trend Model: Neutral as of 9/13/2018
LT Trend Model: SELL as of 9/18/2018
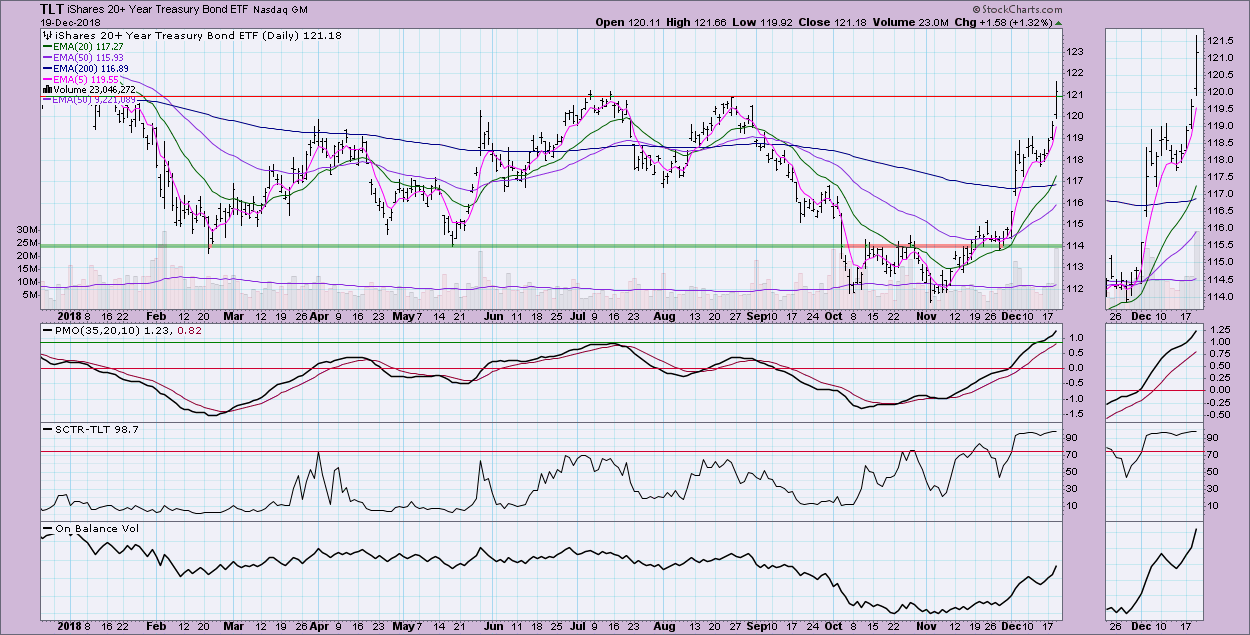
TLT Daily Chart: With an uncertain market and the words from the Fed, Bonds took off. TLT broke out above long-term resistance. The PMO is not overbought and can accommodate more upside movement. This week's move is parabolic, so I suspect we will see a pullback soon.
Technical Analysis is a windsock, not a crystal ball.
Happy Charting!
- Erin
**Don't miss any of the DecisionPoint commentaries! Go to the "Notify Me" box toward the end of this blog page to be notified as soon as they are published.**
NOTE: The signal status reported herein is based upon mechanical trading model signals, specifically the DecisionPoint Trend Model. They define the implied bias of the price index based upon moving average relationships, but do not necessarily call for a specific action. They are information flags that should prompt chart review. Further, they do not call for continuous buying or selling during the life of the signal. For example, a BUY signal will probably (but not necessarily) return the best results if action is taken soon after the signal is generated. Additional opportunities for buying may be found as price zigzags higher, but the trader must look for optimum entry points. Conversely, exit points to preserve gains (or minimize losses) may be evident before the model mechanically closes the signal.
Helpful DecisionPoint Links:
DecisionPoint Shared ChartList and DecisionPoint Chart Gallery
Price Momentum Oscillator (PMO)
Swenlin Trading Oscillators (STO-B and STO-V)

