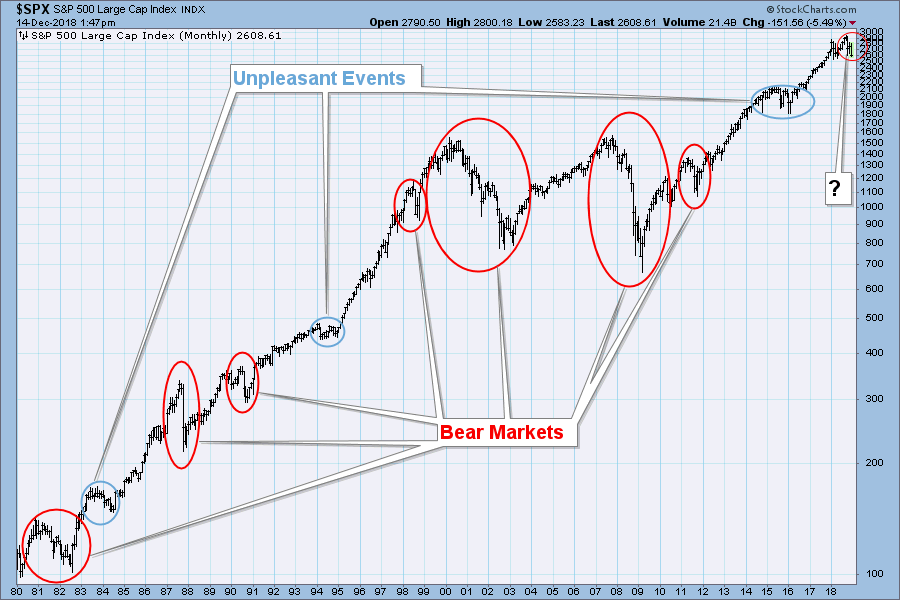
The chart below shows the entire period during which I have been involved in stock market analysis, and, as you can see, the title of this article definitely does not apply to me. If a decline of -20% or more qualifies as a bear market, then I have experienced seven of them. Additionally, there were three periods which, while not qualifying as bear markets, were sufficiently unpleasant to qualify them for 'honorable mention.' I have identified the current decline with a question mark, because we won't know if it qualifies as a bear market until the the benchmark -20% decline is in; however, bear market evidence continues to appear, and I believe we're in a bear market now.
By comparison, anyone with 10 years experience in the market has only seen the 2011 baby bear and a mild correction. A person with such limited experience is at a serious disadvantage. 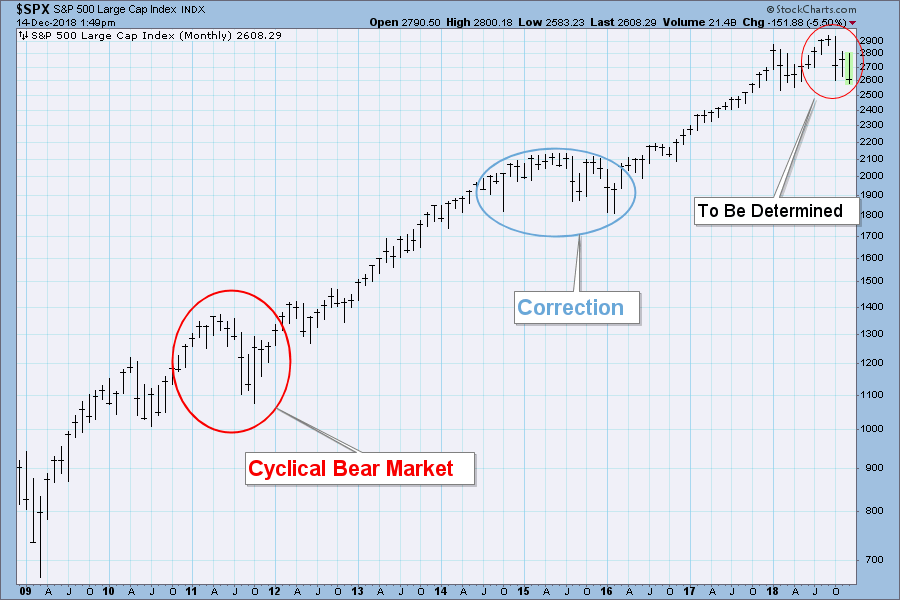 I was going to say that he/she cannot imagine what lies ahead in a real bear market, but that would be wrong. Using technical analysis, a determined individual can study past bear markets and imagine very well what the experience might have been like. In particular, apply favored indicators to bear market periods and observe how they behave. For example, overbought and oversold mean completely different things in a bear market. Learn the difference.
The DecisionPoint Weekly Wrap presents an end-of-week assessment of the trend and condition of the stock market (S&P 500), the U.S. Dollar, Gold, Crude Oil, and Bonds.
SECTORS
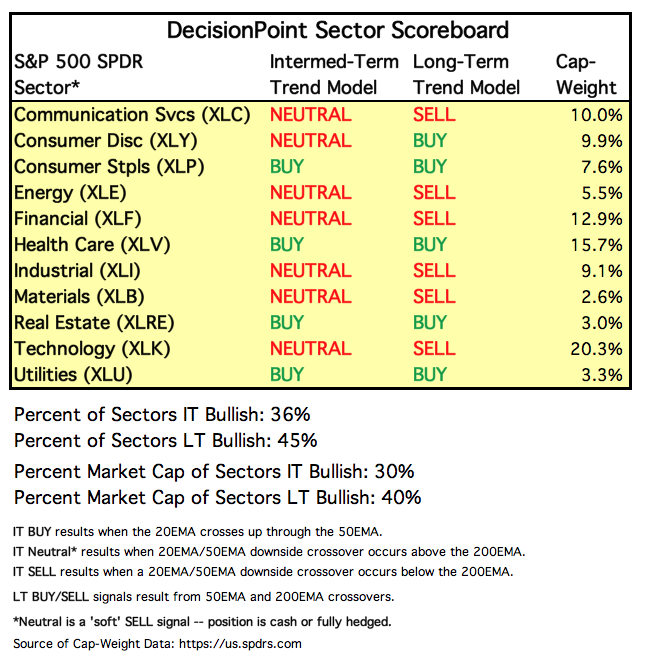
Each S&P 500 Index component stock is assigned to one, and only one, of 11 major sectors. This is a snapshot of the Intermediate-Term and Long-Term Trend Model signal status for those sectors.
STOCKS
IT Trend Model: NEUTRAL as of 10/15/2018
LT Trend Model: SELL as of 12/14/2018
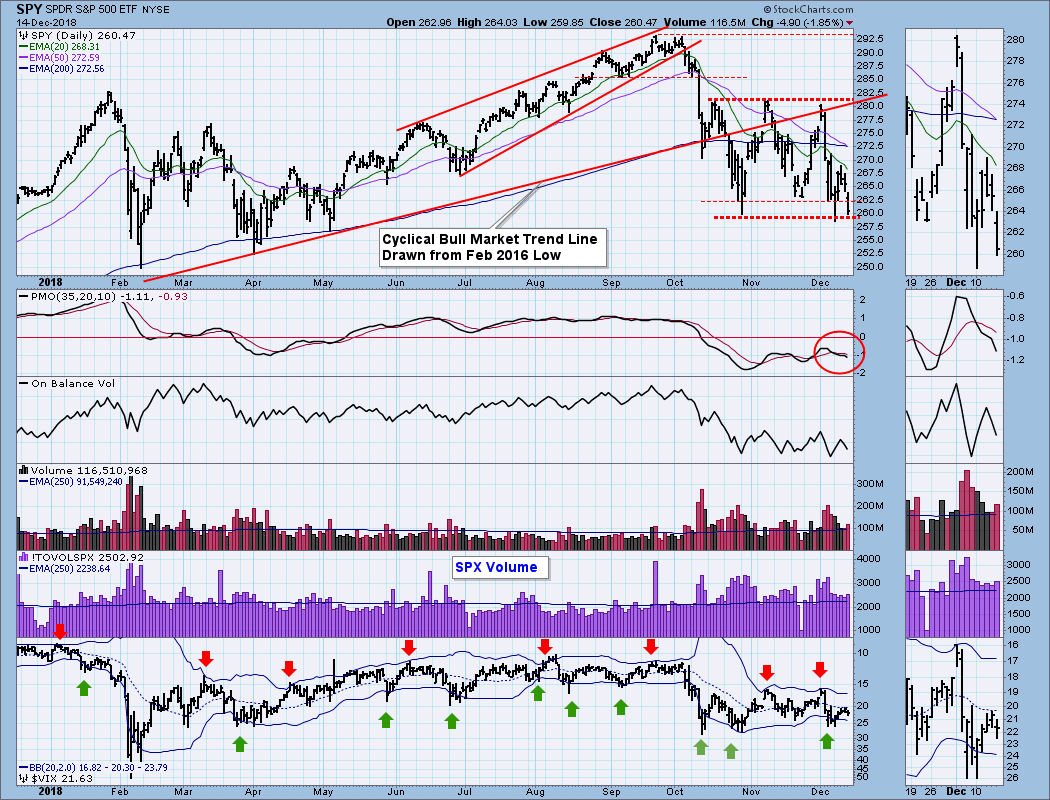
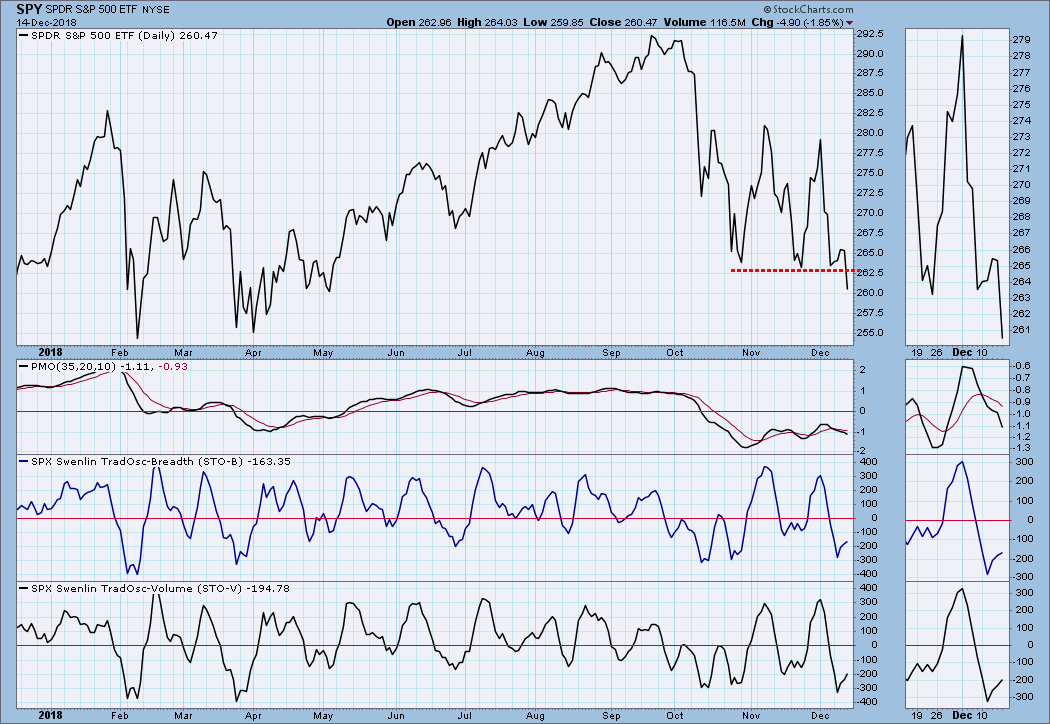
SPY Daily Chart: The 50EMA is only 0.03 of a point above the 200EMA, and a downside crossover is guaranteed on Monday (unless SPY rallies +6%), so I have changed the LT Trend Model to a SELL. That makes it official that SPY is in a bear market. No, the -20% benchmark has not been reached, but the EMA crossover requires that we change our expectations to bearish (if we hadn't already done so).
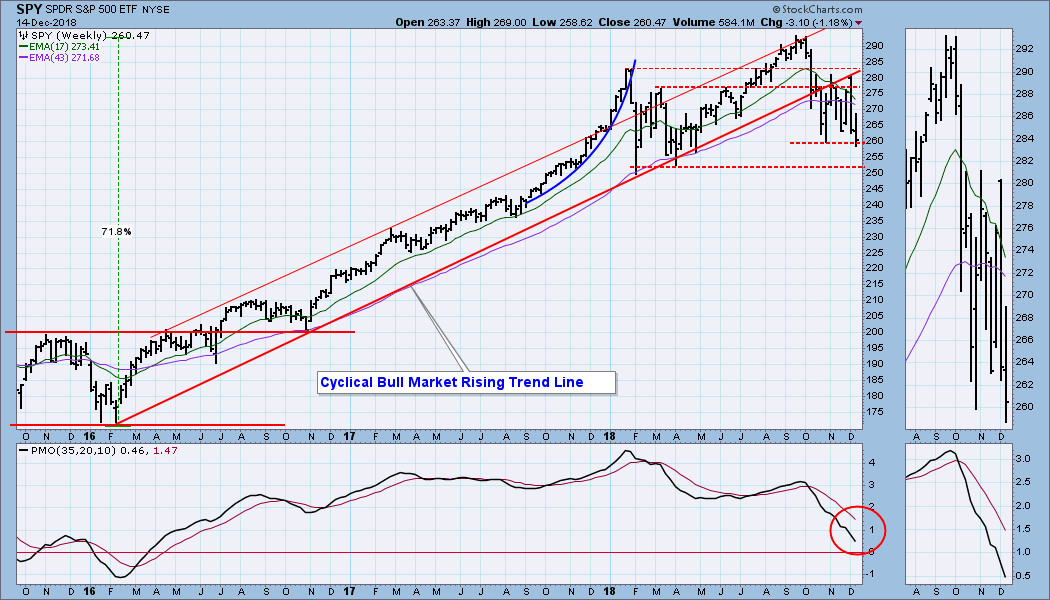
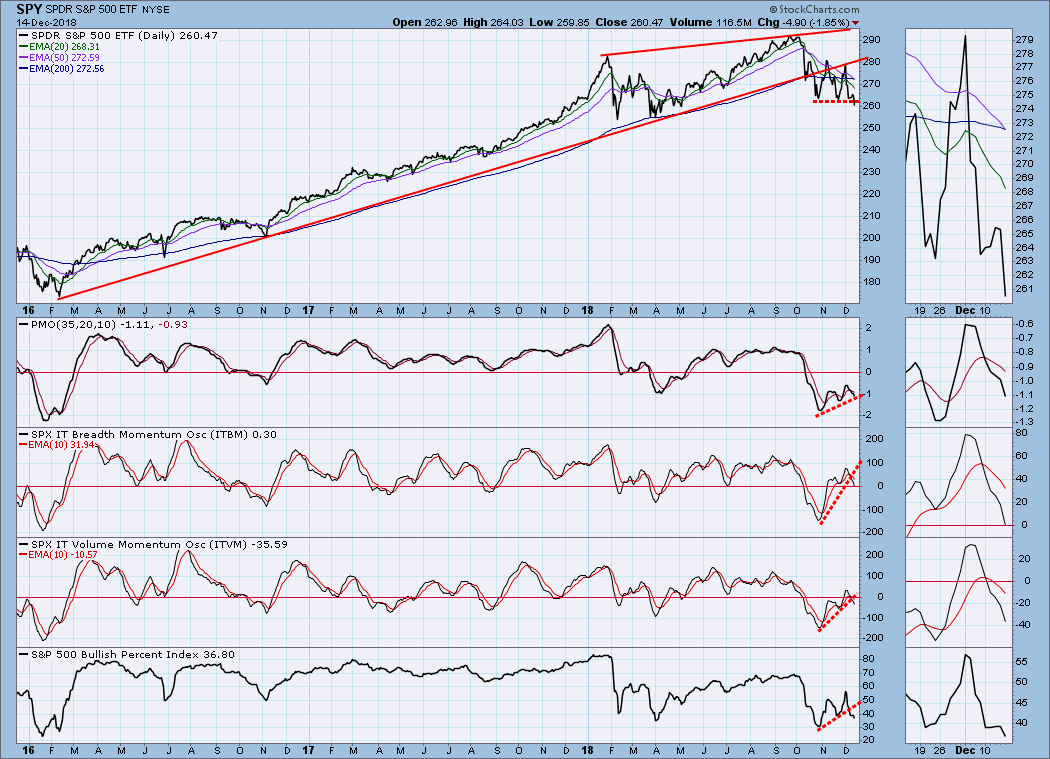
SPY Weekly Chart: There are still a couple of support lines left to violate in order for all hope to be abandoned.
ULTRA-Short-Term Market Indicators: In the lower right corner note that the VIX has hit the moving average line and turned back down. To me this means that we should expect more selling next week.
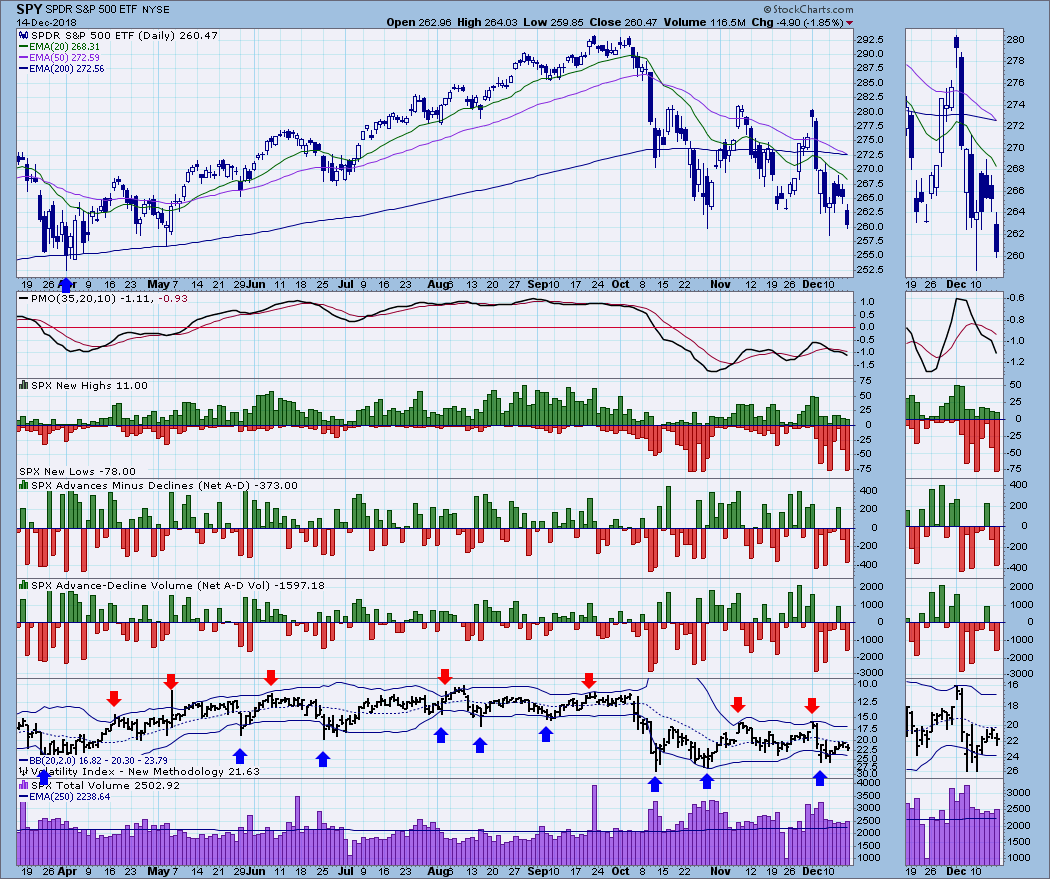
Short-Term Market Indicators: The STO-B and STO-V are rising, but they are decelerating and will probably top next week. Also, note that the line chart clarifies support (or lack thereof) based upon closing prices.
Intermediate-Term Market Indicators: Okay, here's a good example of how positive divergences are less likely to work during bear markets. It is really a case where oversold indicators unwind (move back toward the zero line) while price moves sideways, whereas, in a bull market the oversold conditions would have triggered a rally with some longevity.
CONCLUSION: The sloppy price movement this week has bear market written all over it, and we finally got a LTTM SELL signal. The line charts show that important support has been broken, and the ease with which that happened should have red flags flying everywhere. Next week is the last full week of trading prior to the two holiday weeks. Options expiration should generate a lot of volume on Friday, but normally we expect it to dampen volatility toward the end of the week. Conversely, the Fed interest rate announcement on Wednesday is likely to generate a lot of volatility, at least on the day of the announcement; however, even if they don't raise rates this time, I don't think it will change the longer-term bear market outcome.
DOLLAR (UUP)
IT Trend Model: BUY as of 4/24/2018
LT Trend Model: BUY as of 5/25/2018
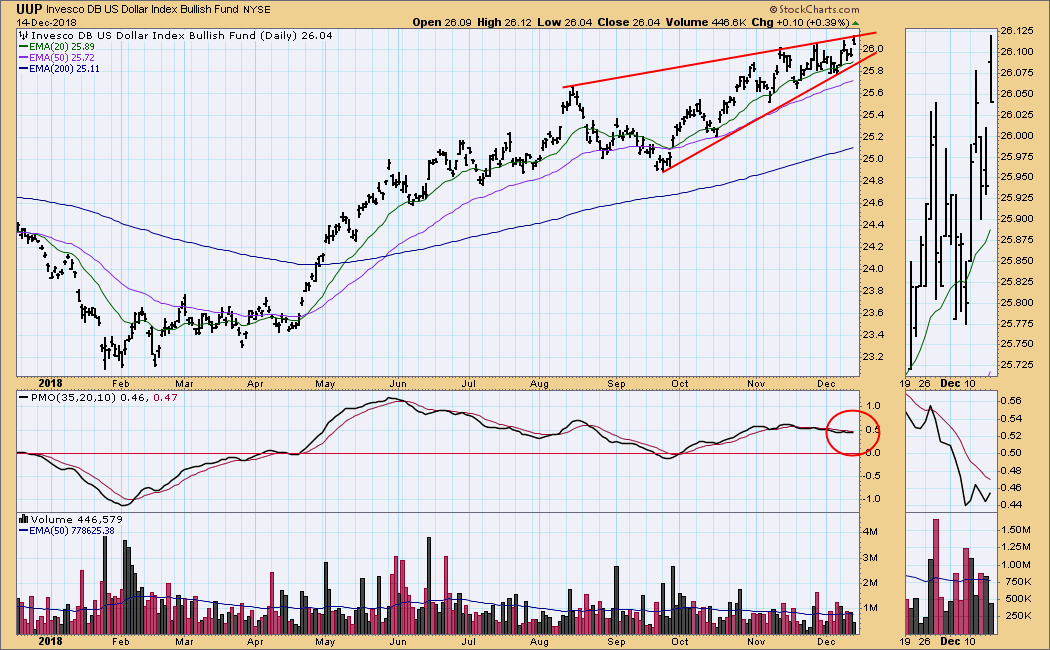
UUP Daily Chart: The daily PMO is positive and running sideways, but the rising wedge will probably resolve downward. Note that this is a sorter-term wedge than is shown on the weekly chart below.
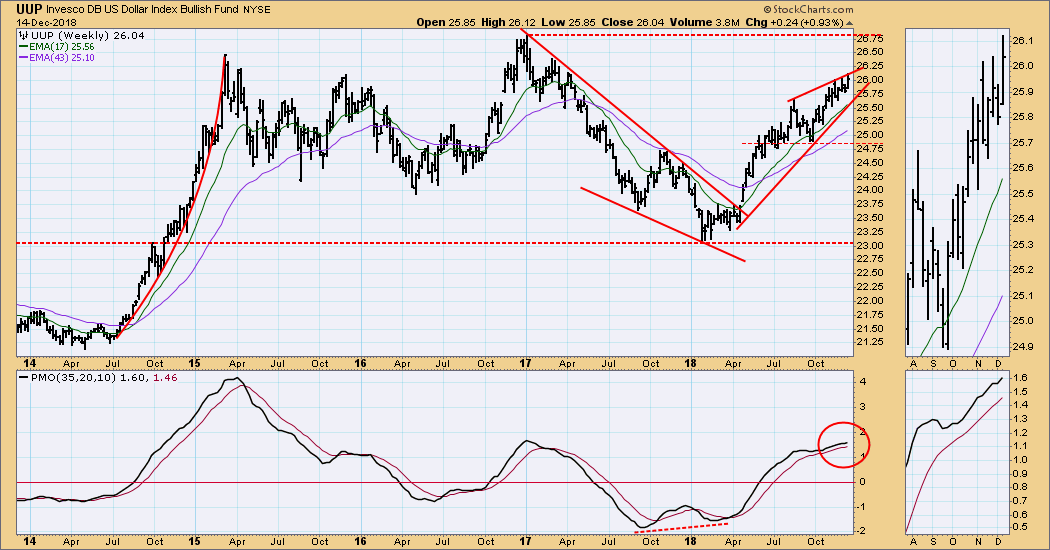
UUP Weekly Chart: Price is near the top of a four-year range, and the dominant pattern is a bearish rising wedge.
GOLD
IT Trend Model: BUY as of 10/19/2018
LT Trend Model: SELL as of 6/22/2018
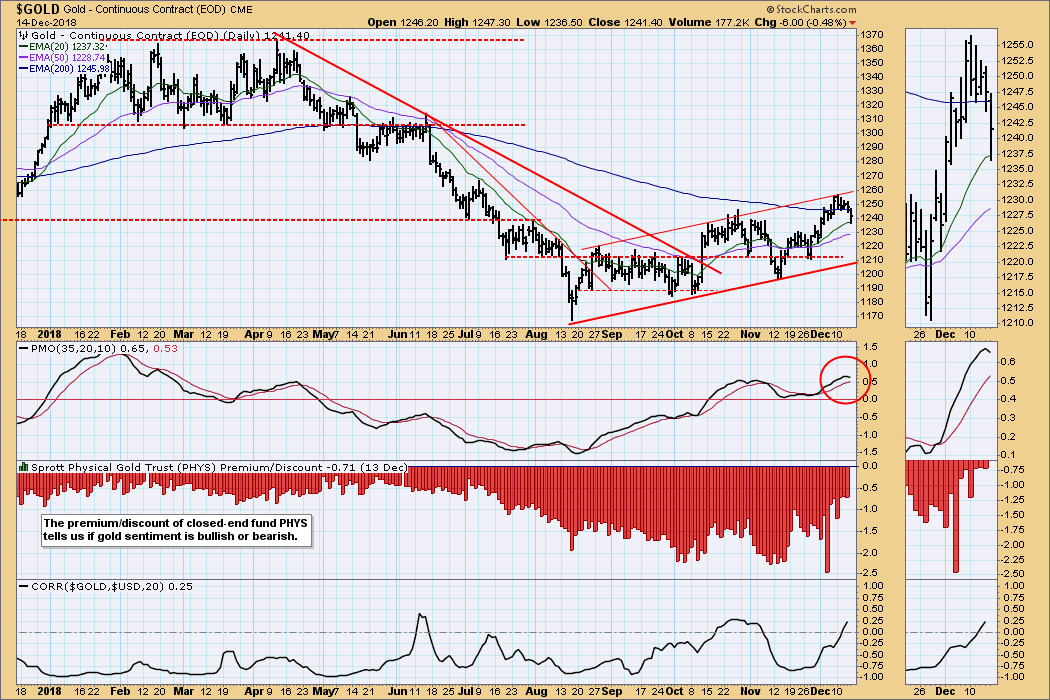
GOLD Daily Chart: Gold has reached the top of the rising trend channel, and the daily PMO has topped. We're probably in for another counter trend correction
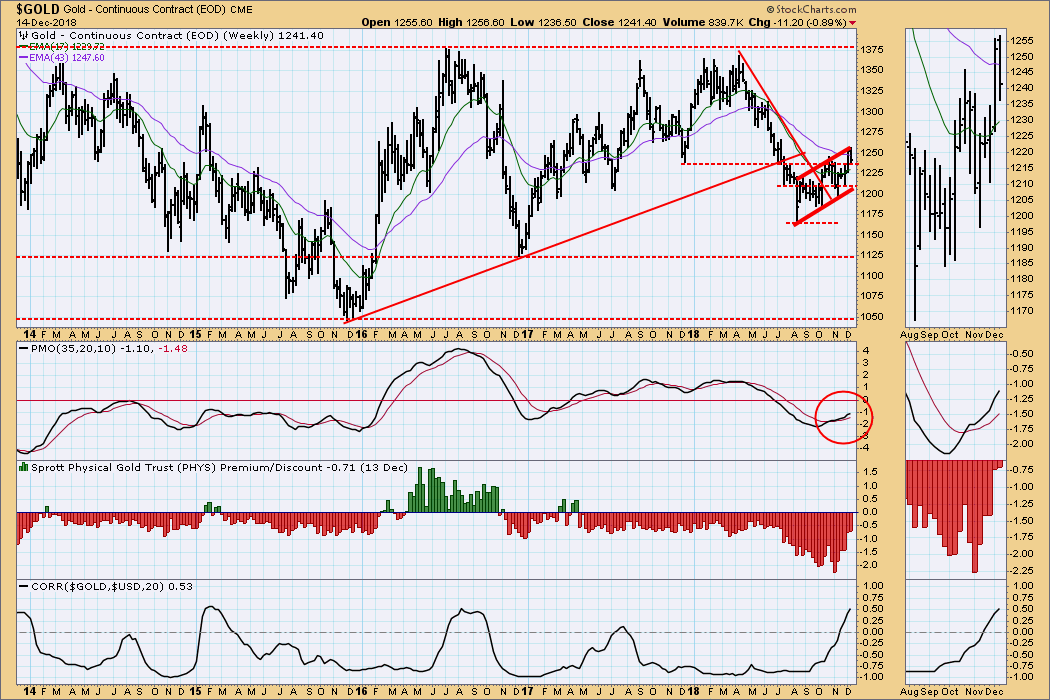
GOLD Weekly Chart: The weekly PMO and price trend are positive.
CRUDE OIL (USO)
IT Trend Model: NEUTRAL as of 10/29/2018
LT Trend Model: SELL as of 11/23/2018
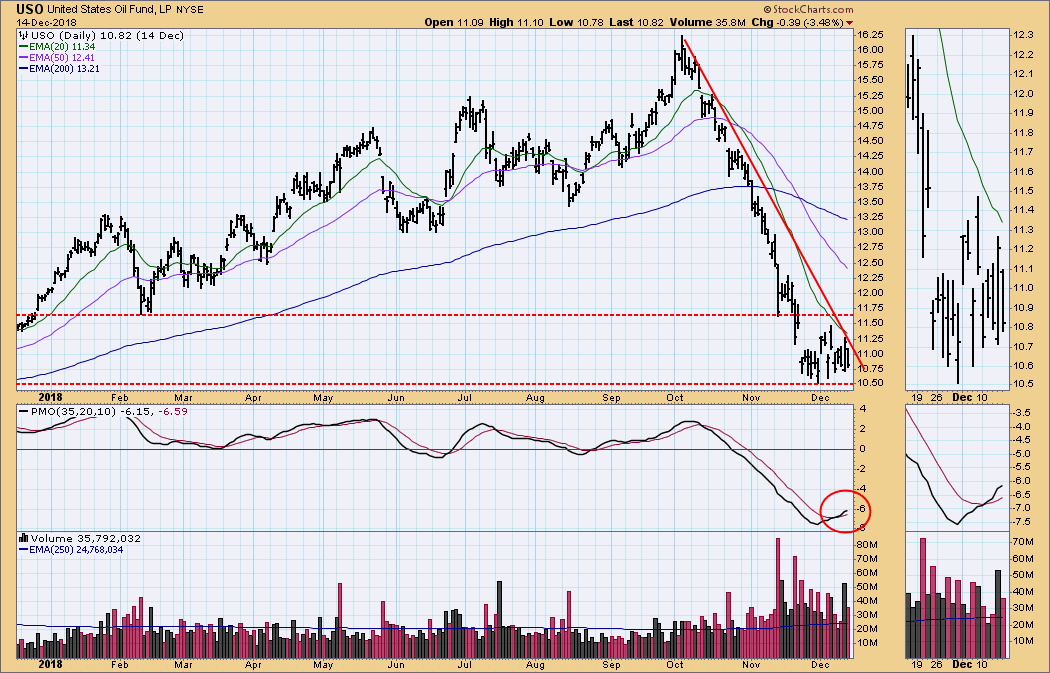
USO Daily Chart: It's not the cleanest one I have seen, but I'm interpreting the cluster at the bottom of the declining trend line as a bearish reverse flag. The daily PMO is above the signal line and moving sideways, but this is kind of a default response to the price pause.
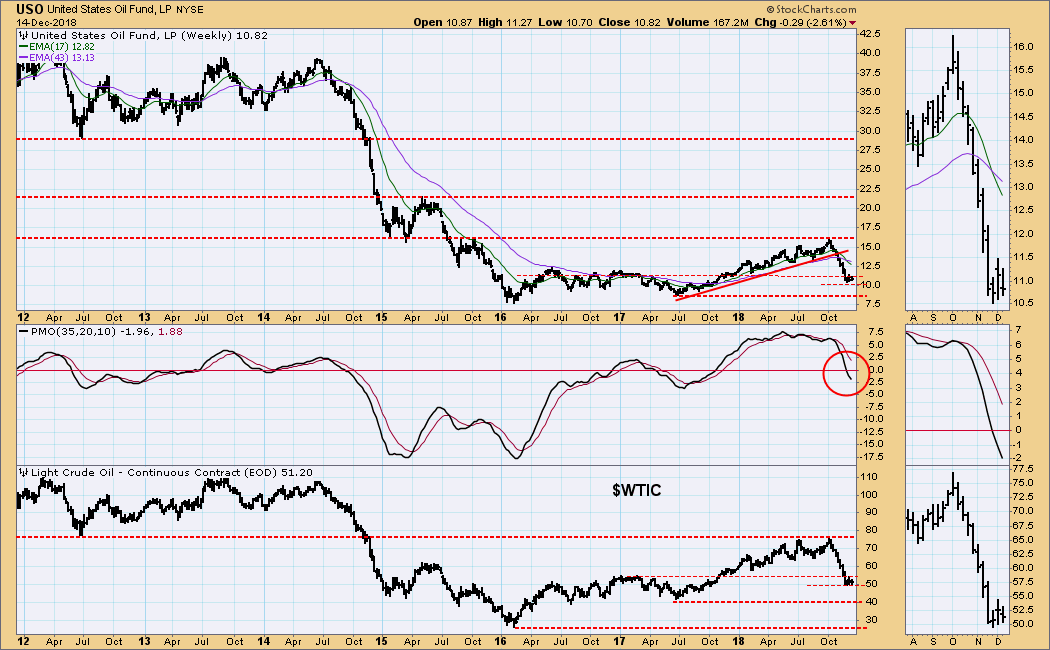
USO Weekly Chart: So far there seems to be support for crude ($WTIC) at 50, but the weekly PMO is still falling.
BONDS (TLT)
IT Trend Model: BUY as of 12/6/2018
LT Trend Model: SELL as of 9/18/2018
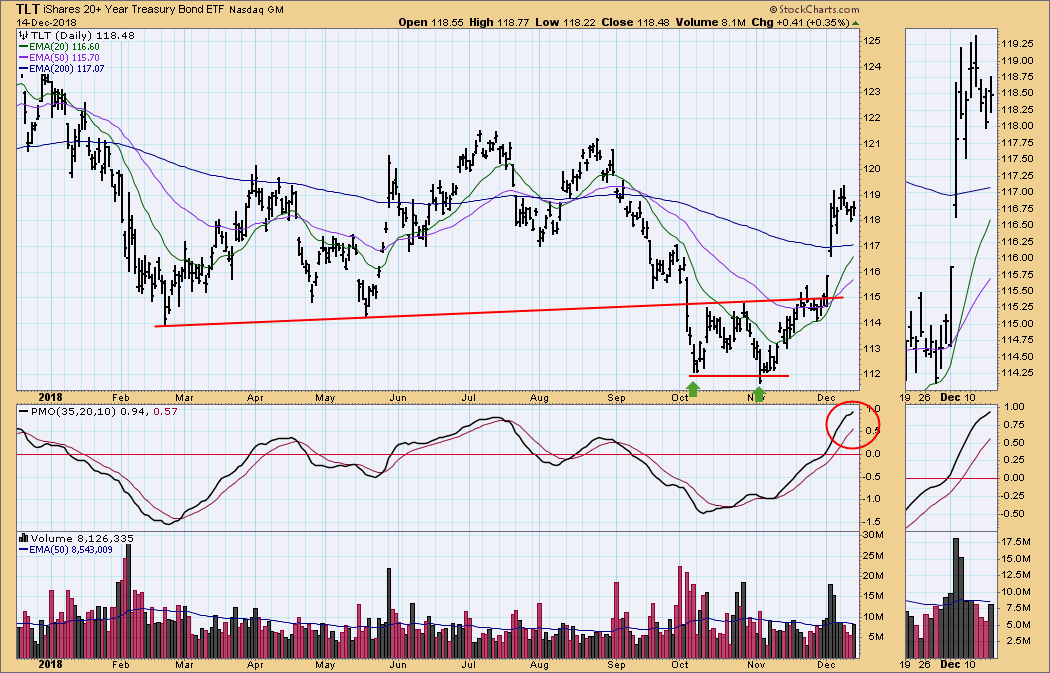
TLT Daily Chart: TLT made a strong break above the double bottom confirmation line, and the subsequent consolidation looks like a bullish flag/pennant. The daily PMO is very overbought for the period shown, but historically the top of the range is much higher.
TLT Weekly Chart: The dominant pattern on this chart is a bearish descending triangle. While the technical expectation is for the pattern to break down, currently the weekly PMO is very positive, and price is trying hard to break out.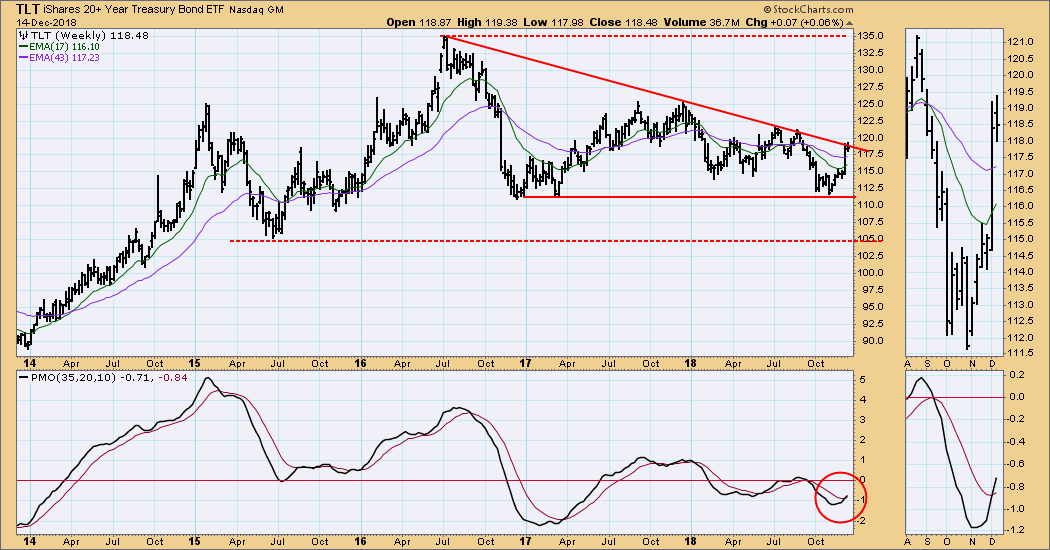
**Don't miss any of the DecisionPoint commentaries! Go to the "Notify Me" box toward the end of this blog page to be notified as soon as they are published.**
Technical Analysis is a windsock, not a crystal ball.
Happy Charting!
- Carl
NOTE: The signal status reported herein is based upon mechanical trading model signals, specifically, the DecisionPoint Trend Model. They define the implied bias of the price index based upon moving average relationships, but they do not necessarily call for a specific action. They are information flags that should prompt chart review. Further, they do not call for continuous buying or selling during the life of the signal. For example, a BUY signal will probably (but not necessarily) return the best results if action is taken soon after the signal is generated. Additional opportunities for buying may be found as price zigzags higher, but the trader must look for optimum entry points. Conversely, exit points to preserve gains (or minimize losses) may be evident before the model mechanically closes the signal.
Helpful DecisionPoint Links:
DecisionPoint Shared ChartList and DecisionPoint Chart Gallery
Price Momentum Oscillator (PMO)
Swenlin Trading Oscillators (STO-B and STO-V)

