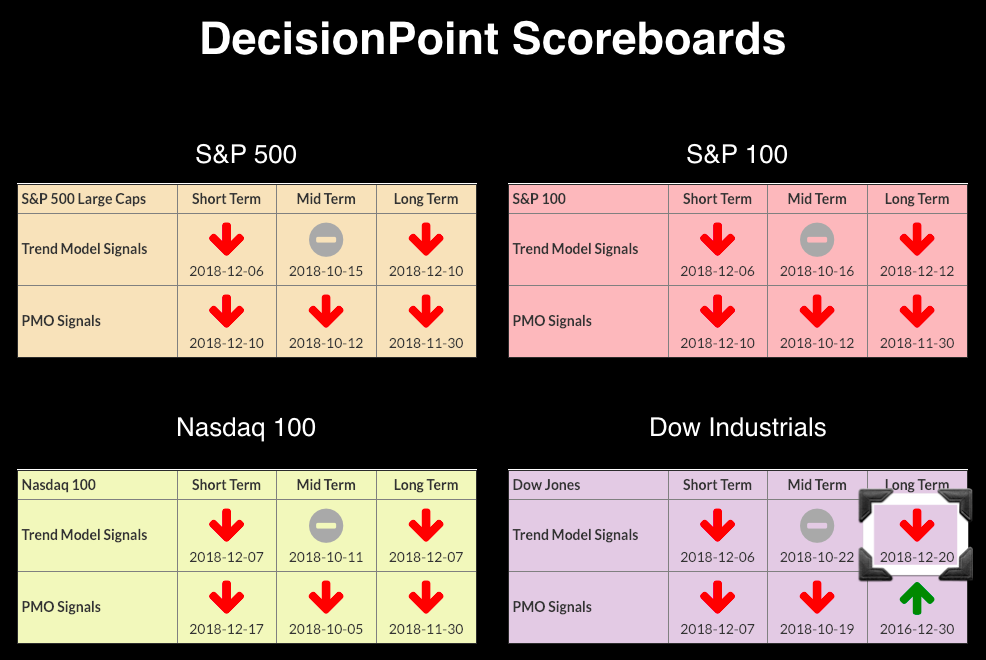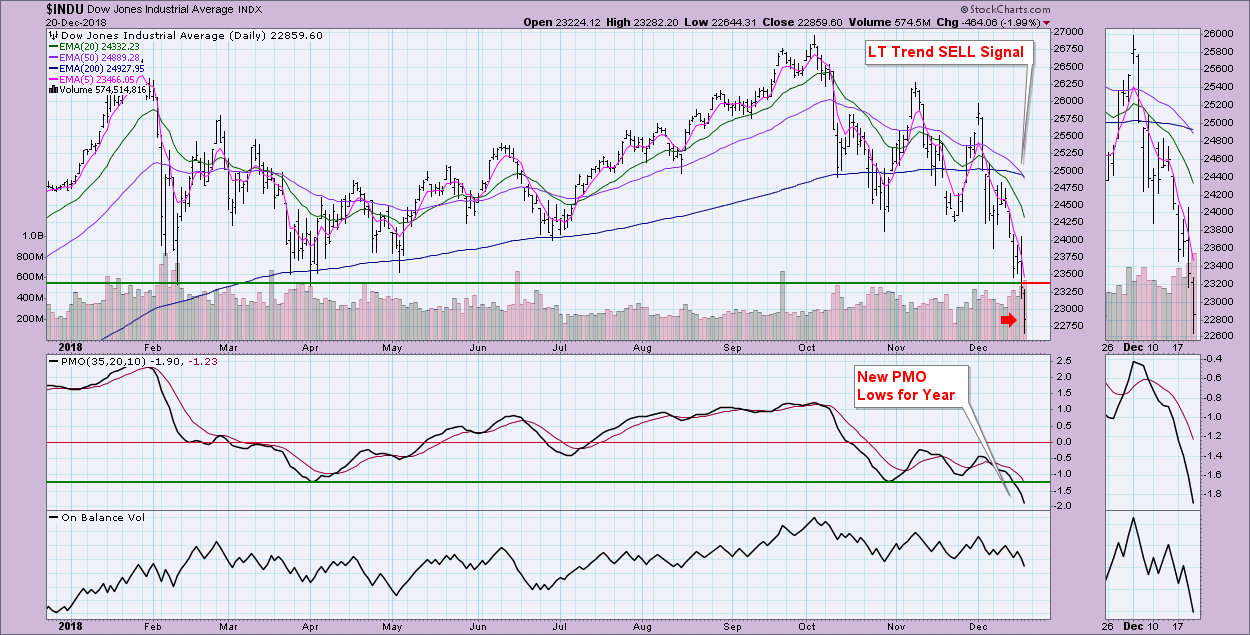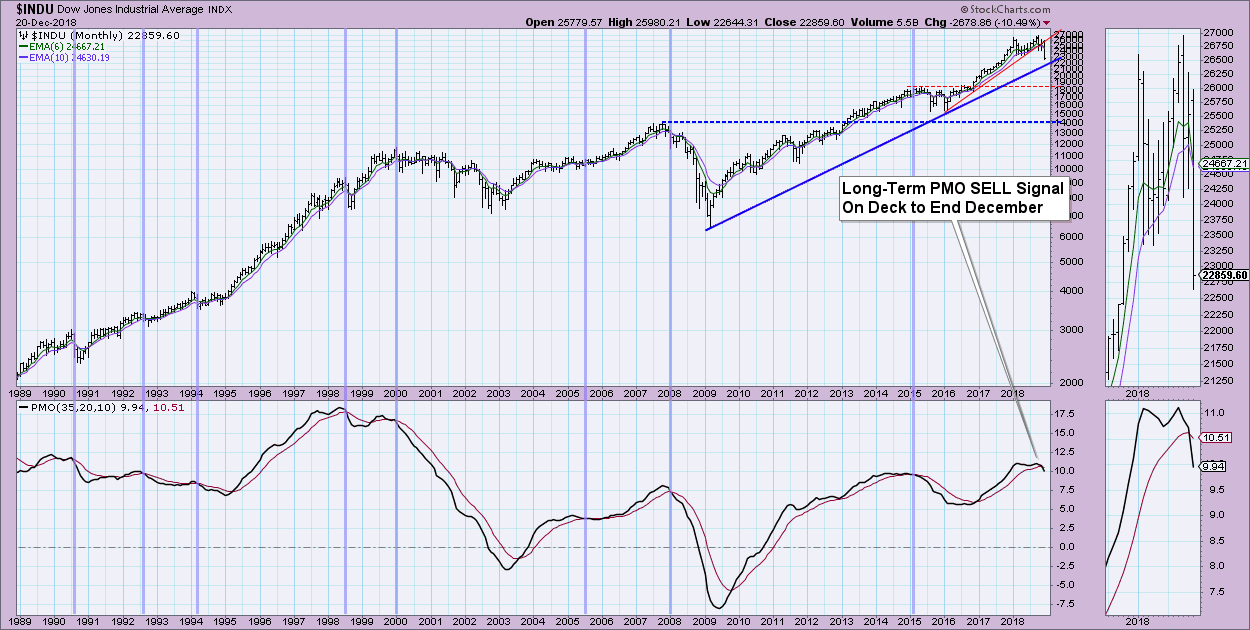
Today, the Dow finally logged its Long-Term Trend Model SELL signal. This signal was triggered when the 50-EMA crossed below the 200-EMA. The Scoreboards below are ugly. The remaining BUY signal will be gone on the final trading day of the month - I highly doubt the PMO will be able to find its way back above the signal in time to prevent it. Below are the new Scoreboards, along with the daily and weekly charts of $INDU. It's highly doubtful that Santa will get here in time Christmas.

Technical Analysis is a windsock, not a crystal ball.
Happy Charting!
- Erin
Helpful DecisionPoint Links:
DecisionPoint Shared ChartList and DecisionPoint Chart Gallery
Price Momentum Oscillator (PMO)
Swenlin Trading Oscillators (STO-B and STO-V)
**Don't miss DecisionPoint Commentary! Add your email below to be notified of new updates"**


