ChartWatchers November 30, 2018 at 02:03 PM
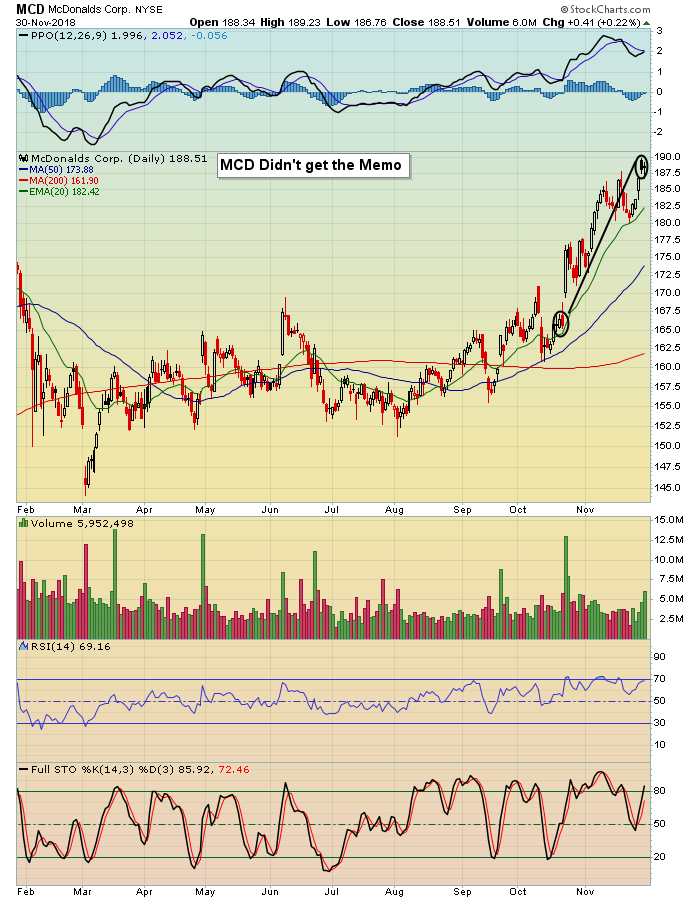
The market finally found its legs last week after the Fed signaled they might slow down their interest rate-raising campaign... Read More
ChartWatchers November 30, 2018 at 01:16 PM
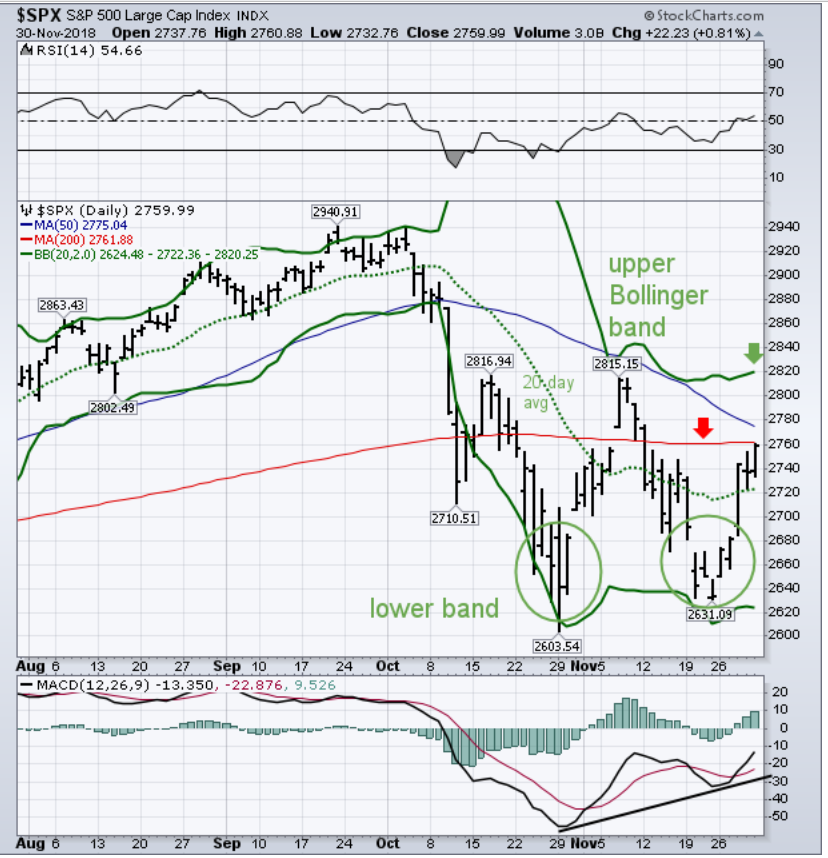
Editor's Note: This article was originally published in John Murphy's Market Message on Friday, November 30th at 2:36pm ET. There are lots of way to determine the trend of the stock market. The placement of moving average lines is one of them... Read More
ChartWatchers November 17, 2018 at 01:56 PM
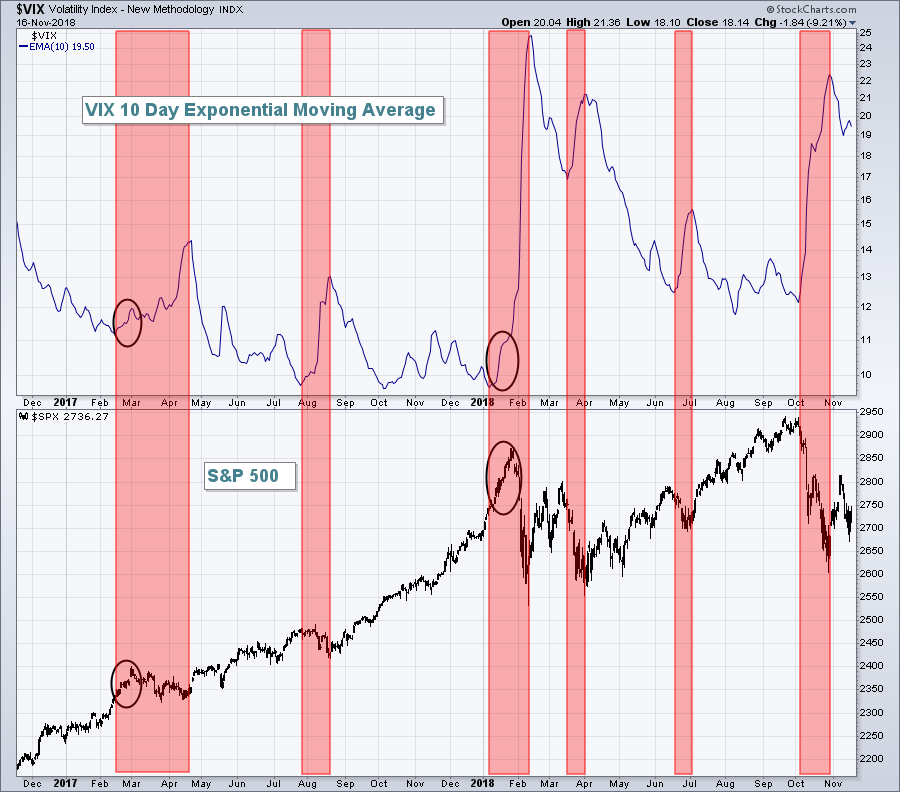
Trading is difficult, emotional and can be quite lonely. We have seen volatility ($VIX) shoot higher, rising from an 11.61 close on October 3rd to a high of 28.84 on October 11th... Read More
ChartWatchers November 17, 2018 at 05:58 AM
The Momentum Factor iShares (MTUM) and the Minimum Volatility iShares (USMV) represent opposing sides of the market. High flying stocks can be found in the momentum ETF, while the more boring issues dominate the minimum volatility ETF... Read More
ChartWatchers November 16, 2018 at 07:46 PM
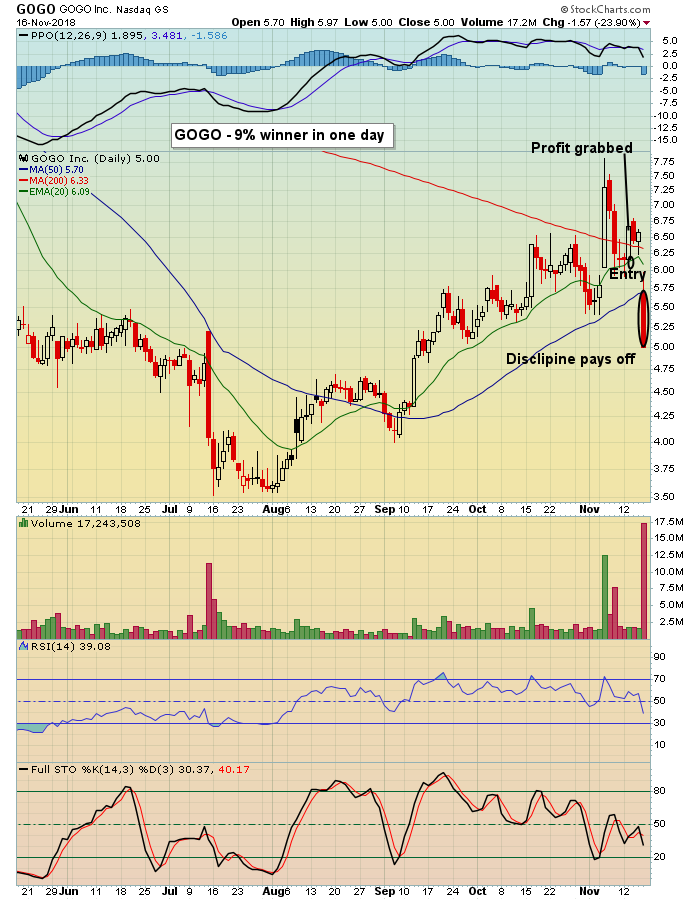
The quarter beginning 10-1-18 has been challenging for a lot of traders. The NASDAQ has lost almost 10% while the S&P has lost 6%, both well off the quarter's low. Volatility has reigned with the VIX at elevated levels for most of the quarter... Read More
ChartWatchers November 16, 2018 at 06:43 PM
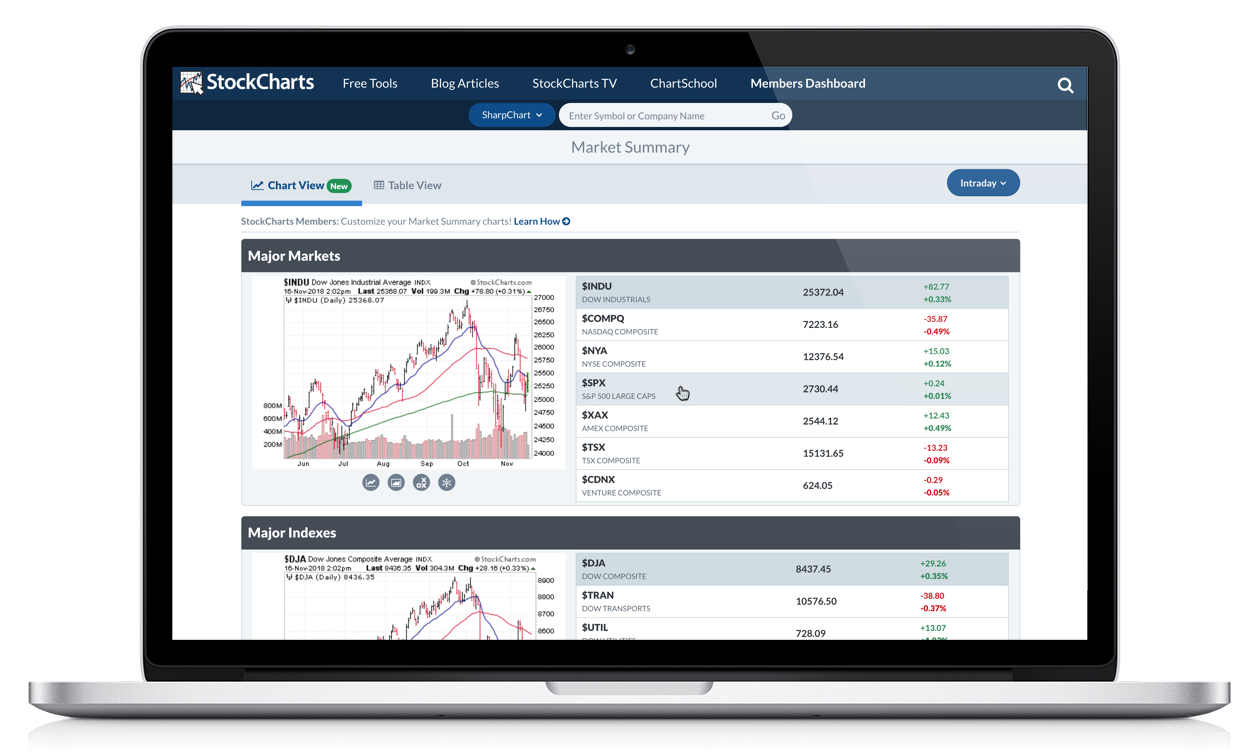
The more charts, the better. That's my motto, especially this week... Read More
ChartWatchers November 16, 2018 at 05:08 PM
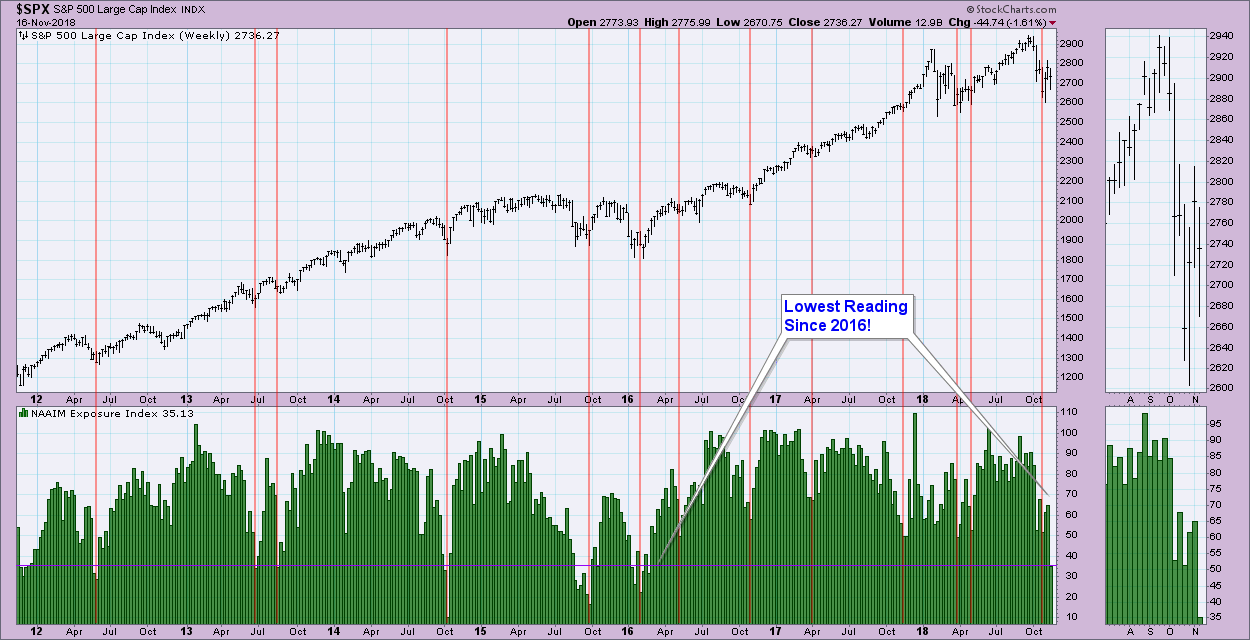
One of the sentiment indicators that I update MarketWatchers LIVE viewers on each Friday is the National Association of Active Investment Managers (NAAIM) exposure reading. A few things you should know about these guys... Read More
ChartWatchers November 16, 2018 at 03:17 PM
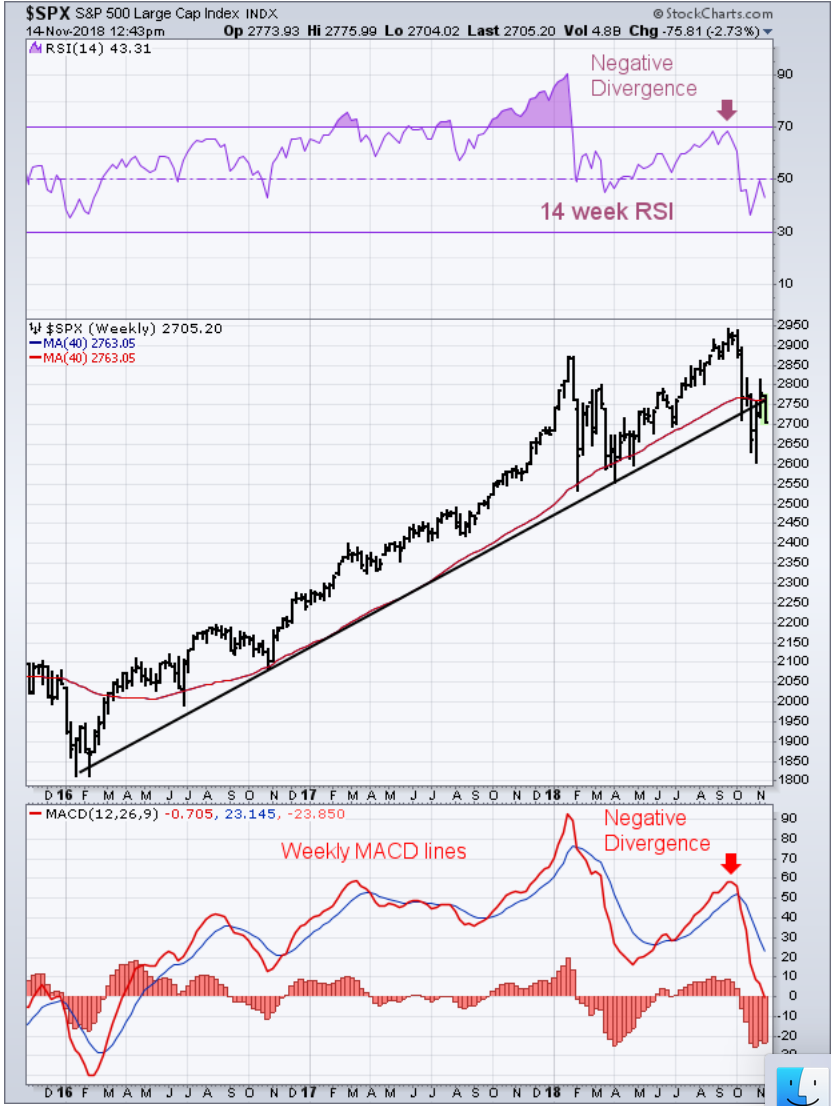
Editor's Note: This article was originally published in John Murphy's Market Message on Wednesday, November 14th at 1:39pm ET. The weekly bars in Chart 2 show the last upleg of the S&P 500 uptrend that began in early 2016. And it shows that uptrend weakening... Read More
ChartWatchers November 16, 2018 at 12:59 PM

Various breadth indicators are used to analyze the underlying strength or weakness of a broad market index like the S&P 500 index or NYSE. Over the years a number of different breadth indicators have been developed and/or used in their work by well known technical analysts... Read More
ChartWatchers November 03, 2018 at 01:25 PM
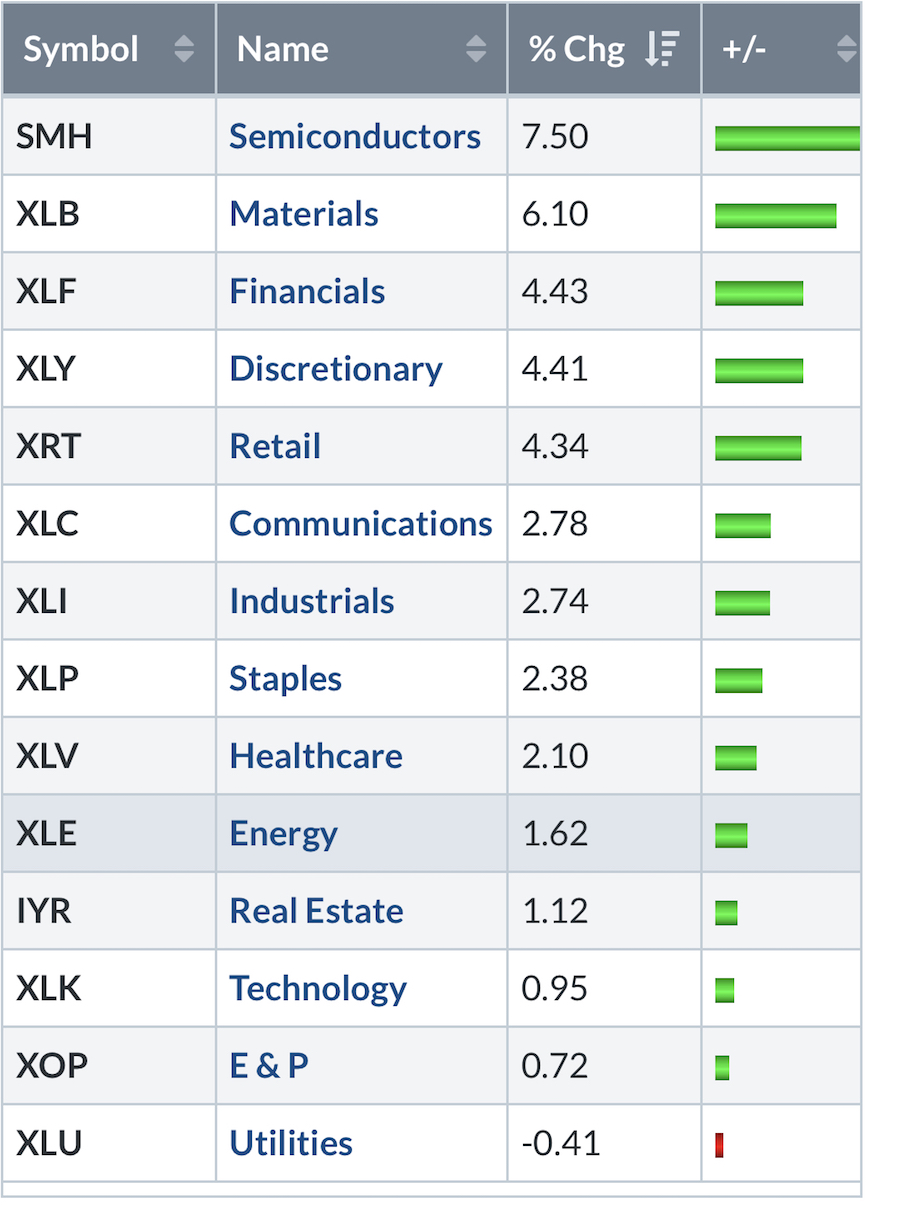
The week that finally bounced! It is always difficult to buy stocks near the lows. The volatility is high and your afraid of further drops. While we never know when the final low will be in advance, we have lots of tools that helps us see an oversold market... Read More
ChartWatchers November 03, 2018 at 12:17 PM
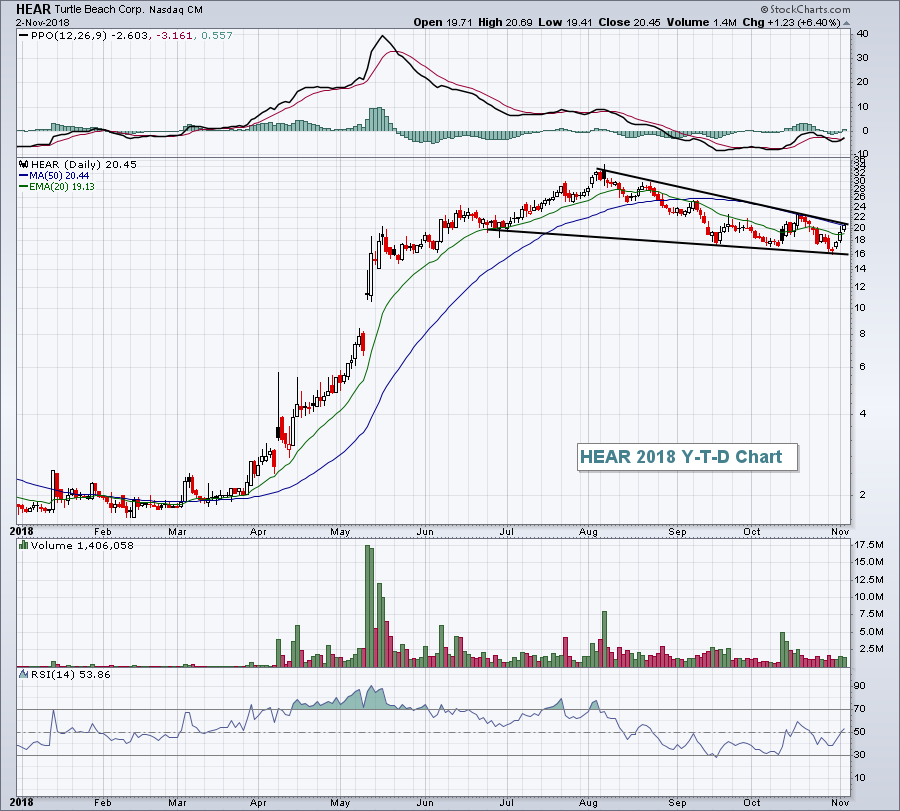
I'm not a fan of buying (or short selling) stocks and holding them into quarterly earnings reports. It's simply too difficult to manage risk... Read More
ChartWatchers November 03, 2018 at 09:13 AM
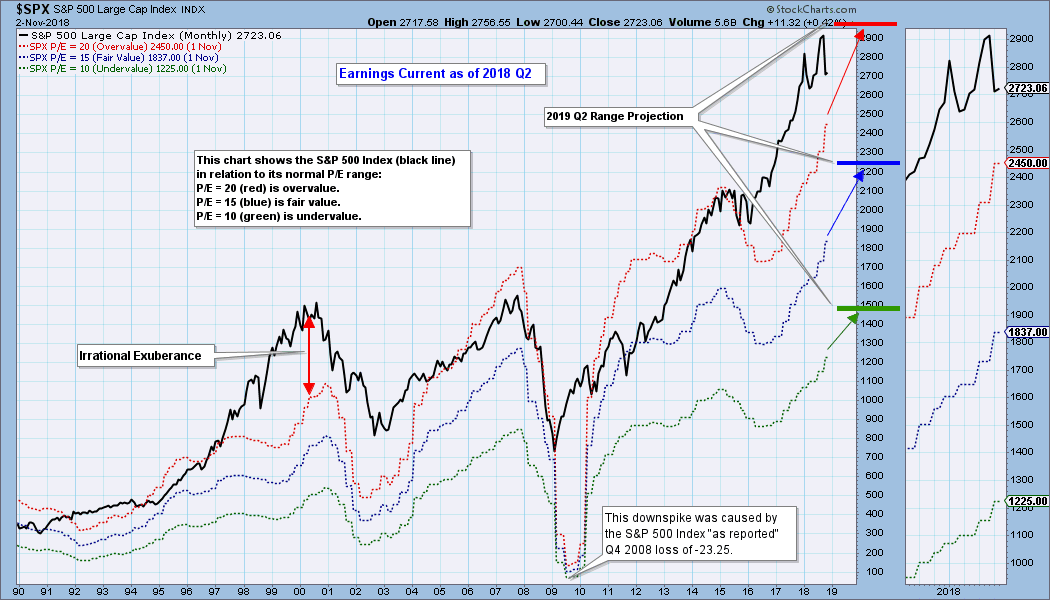
Charts of fundamental data are as useful as price charts in helping us visualize fundamental context and trends... Read More
ChartWatchers November 02, 2018 at 07:04 PM
To kick off the new month, I'm thrilled to announce another all-star addition to our StockCharts commentary team... Read More
ChartWatchers November 02, 2018 at 05:49 PM

Gold, silver and platinum suffered selling pressure over the last few years, but palladium attracted buying pressure and outperformed. It is one of the few precious metals trading near a 52-week high and in a long-term uptrend... Read More
ChartWatchers November 02, 2018 at 01:52 PM
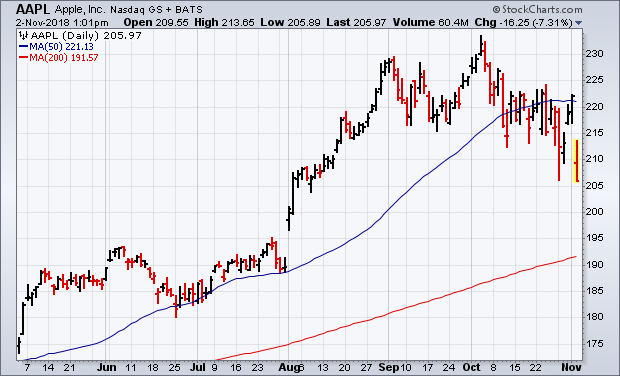
Editor's Note: This article was originally published in John Murphy's Market Message on Friday, November 2nd at 12:28pm ET. It's usually not a good sign when the market's biggest stock takes a big hit... Read More
ChartWatchers November 02, 2018 at 01:46 PM
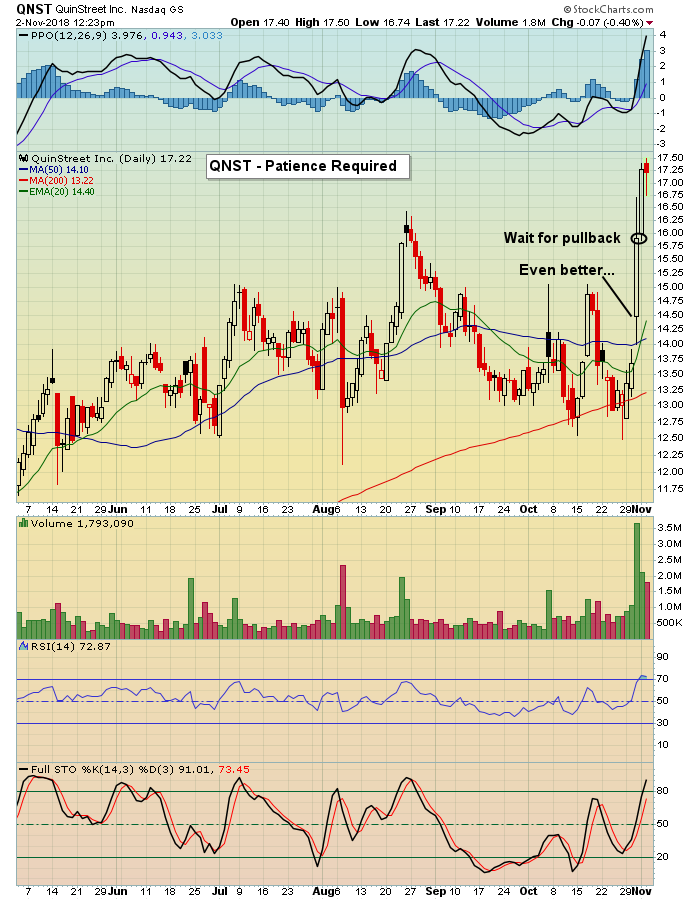
We're deep into earnings season, which means patient traders can put themselves into a position to profit handsomely... Read More