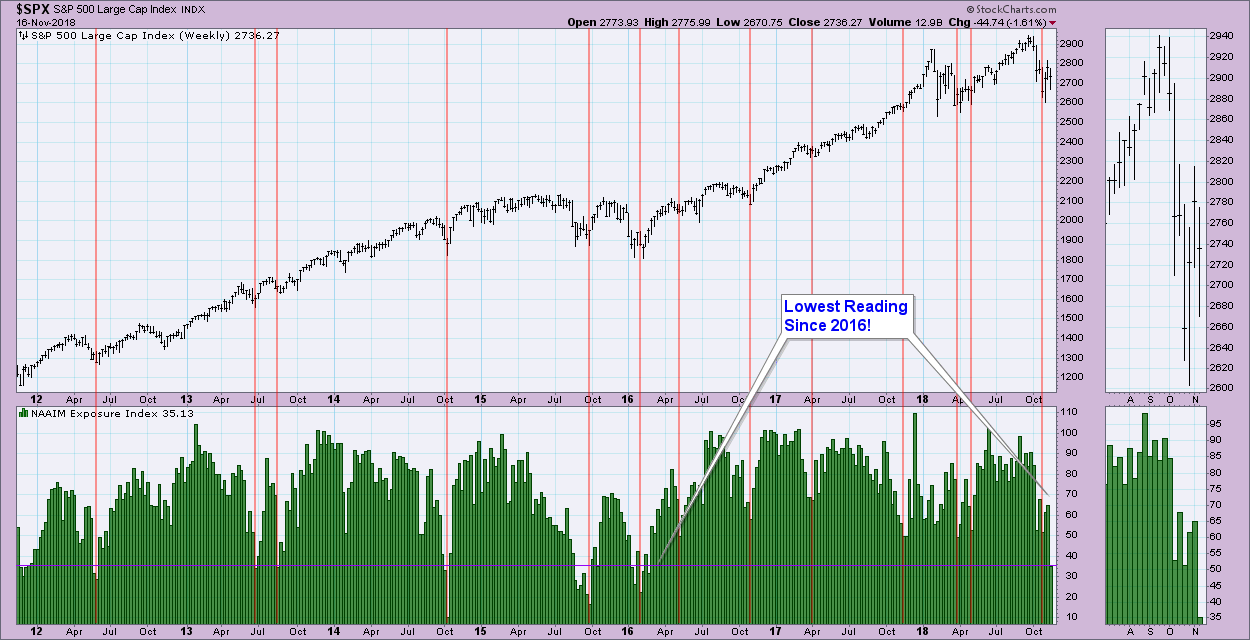
One of the sentiment indicators that I update MarketWatchers LIVE viewers on each Friday is the National Association of Active Investment Managers (NAAIM) exposure reading. A few things you should know about these guys. NAAIM’s membership ranges from small regional firms to large national firms, including hedge fund managers, mutual fund companies and a variety of other firms that provide professional services. Many of them are technicians. They will sometimes be "right" in their exposure in the very short term, but in the intermediate term, price reversals nearly always occur.
First note that NAAIM exposure to the market pulled WAY back, so far back that the reading was the lowest we've seen since early 2016! Sentiment is contrarian, meaning if sentiment is very bearish, that is bullish for the market. This very low reading is bullish for the market in the intermediate term.
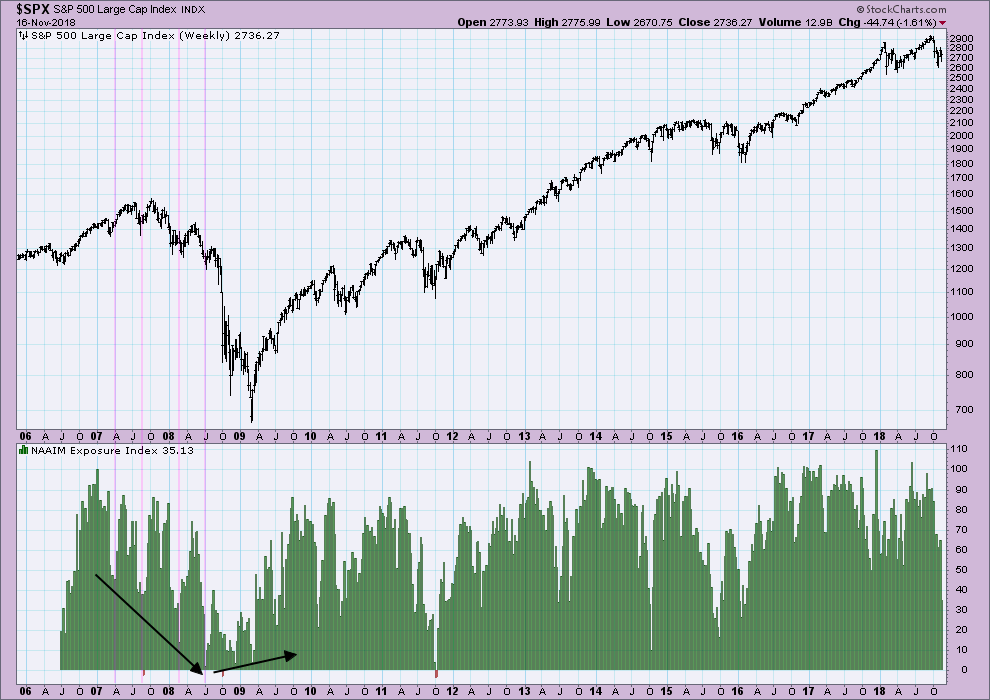
However.... note what happened before the bear market of 2007. Low exposure did lead to short-term rallies, but exposure was lower and lower, until the dam broke. Unfortunately we only have data back to 2006 so I don't have another bear market to compare this to. Mainly I just want to caveat the chart above with this longer-term weekly chart below. While low exposure readings lead to short-term rallies, we need to watch the low readings and determine if they are rising or falling. Since the start this October, each of the low readings was followed by a lower reading than the previous.
Conclusion: Typically very low readings like we have today lead to market rallies. While historically low exposure readings are being logged this week, each extreme reading is followed by a lower extreme reading. I would expect a small rally or bounce, but we need to be cautious if these extremely low exposure readings continue lower. It could be a precursor to a bear market, so we aren't out of the woods yet.
Technical Analysis is a windsock, not a crystal ball.
Happy Charting!
- Erin
Helpful DecisionPoint Links:
DecisionPoint Shared ChartList and DecisionPoint Chart Gallery
Price Momentum Oscillator (PMO)
Swenlin Trading Oscillators (STO-B and STO-V)
**Don't miss DecisionPoint Commentary! Add your email below to be notified of new updates"**


