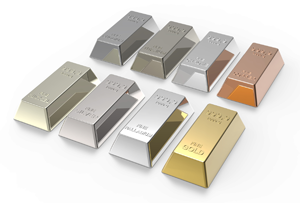
 Gold, silver and platinum suffered selling pressure over the last few years, but palladium attracted buying pressure and outperformed. It is one of the few precious metals trading near a 52-week high and in a long-term uptrend.
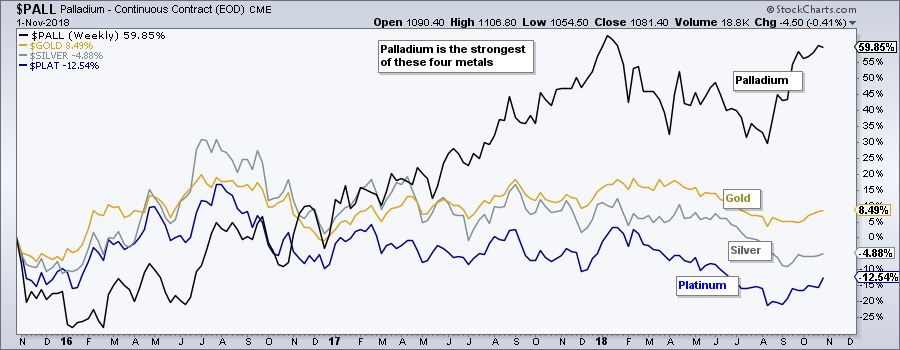
The first chart shows three year performance for the continuous futures contracts for Palladium ($PALL), Platinum ($PLAT), Gold ($GOLD) and Silver ($SILVER). Performance for the latter three peaked in summer 2016 and fell into 2018. Palladium, in contrast, moved higher from early 2016 to early 2018 and is up over 50% the last three years.
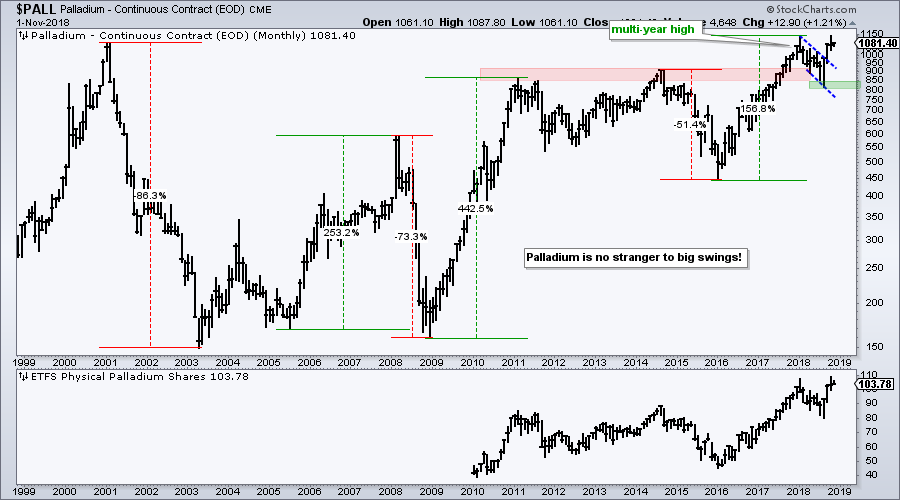
The next chart shows monthly price bars over the last twenty years and Palladium hit a multi-year high early this year. After correcting for a few months, price broke out of a falling flag with a surge above 1000 in September. Prices stalled in October, but the breakout remains in play and bullish. Support is set at 800. The lower window shows the Palladium ETF (PALL) for reference.
On Trend on Youtube
Available to everyone, On Trend with Arthur Hill airs Tuesdays at 10:30AM ET on StockCharts TV and repeats throughout the week at the same time. Each show is then archived on our Youtube channel.
Topics for Tuesday, October 31st:
- New Low Parade Grows (FB, C, GS, LMT, SLB, FDX, TXN)
- %Above EMA Indicators (way oversold, BUT)
- XLV Stalling at Potential Reversal Zone, BUT (plus XLP, XLU)
- Bear Wedge for TLT (plus Junk Yields Rise)
- Gold and Natty Hold Breakouts
- AskArthur Q&A: MA Settings, Cash and Drawdowns
- Click here to Watch
Plan Your Trade and Trade Your Plan.
- Arthur Hill, CMT
Senior Technical Analyst, StockCharts.com
Book: Define the Trend and Trade the Trend
Twitter: Follow @ArthurHill


