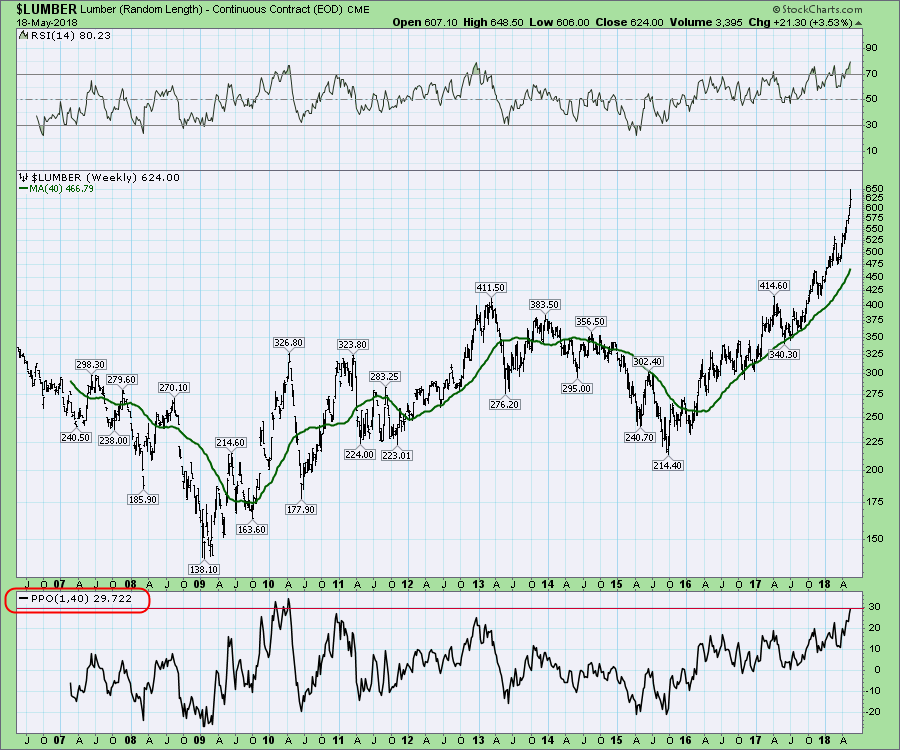
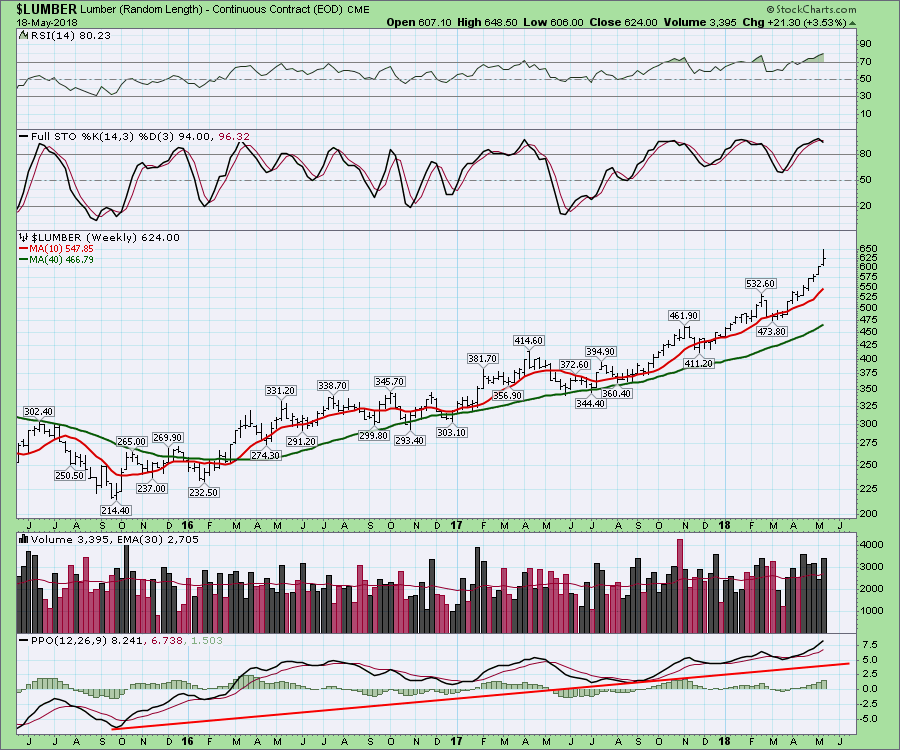
The continuous contract chart of $LUMBER has been on a tear recently. This week the price was almost $200 above the 40-week moving average. With a futures price of $650, that is 30% above the 40-week moving average!
While new highs are typically followed by new highs, this chart is clearly in blue-moon territory or rarified air.
StockCharts has $LUMBER data going back to 2006. A look over the past suggests caution. In the lowest panel I have shown the PPO with a (1,40) setting. This calculates the difference between the current weekly moving average of 1-week (Friday's close) with the 40-week moving average. The price accelerated fast back in the spring of 2010. However, within a few weeks it was a rather quick transition. Notice all the extremes in price movement were quickly reversed once they started. With three recent RSI thrusts above 70, this also suggests some caution based on history.
 If you are invested in Forestry stocks, this is a good time to make sure to protect your treetop gains.
I host a new TV show on StockCharts.com called The Final Bar. It airs Thursdays at 5 PM ET and is repeated throughout the week on StockCharts TV. You can also catch it on my Vimeo channel or on the StockCharts.com YouTube Channel.
Good trading,
Greg Schnell, CMT, MFTA
Senior Technical Analyst, StockCharts.com
Book: Stock Charts for Dummies
Twitter: Follow @Schnellinvestor

