ChartWatchers November 19, 2016 at 05:20 PM
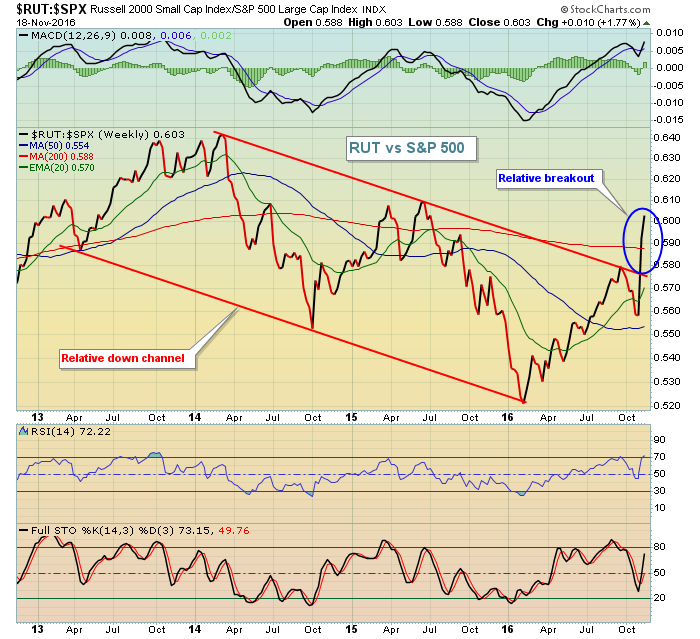
The Russell 2000 is a small cap index and it had been lagging for quite awhile....until 2016. This year the Russell 2000 is wildly outperforming the S&P 500 and now we're heading into December, its most bullish calendar month of the year by far... Read More
ChartWatchers November 19, 2016 at 04:51 PM
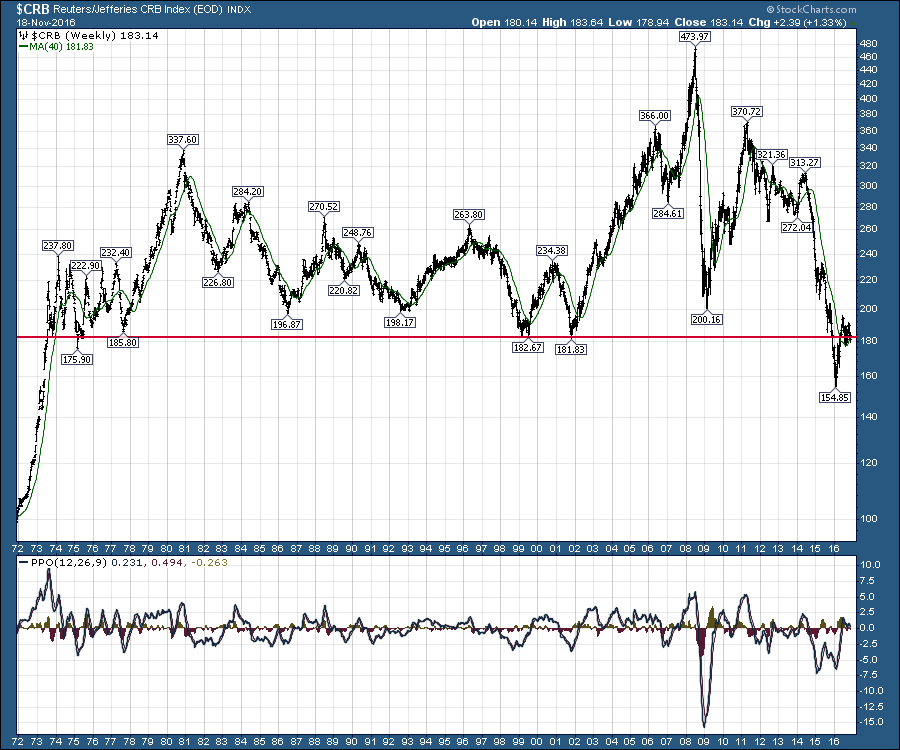
The long term chart for the $CRB continues to be a worry for technicians like me trying to understand why Commodities are having trouble staying above the 45 year trend line. Oil reached lows around $10-$12 in the 2000 period whereas now the oil low was $25... Read More
ChartWatchers November 19, 2016 at 02:34 PM
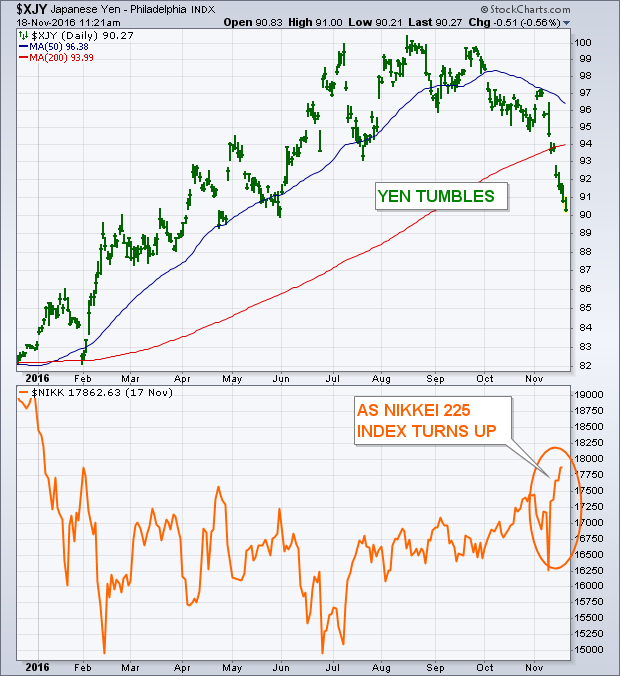
My October 6 market message suggested that the Japanese yen was peaking which would give a boost to export-oriented Japanese stocks which appeared to be bottoming... Read More
ChartWatchers November 19, 2016 at 09:33 AM
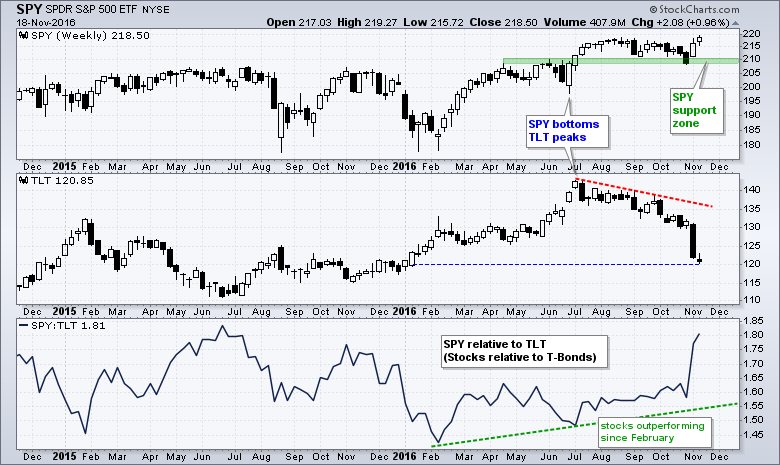
The market began its move to riskier assets in July and this move simply accelerated over the last two weeks. The chart below shows stocks (risk assets) bottoming in late June and Treasury bonds (safe-haven assets) peaking in early July... Read More
ChartWatchers November 18, 2016 at 08:25 PM
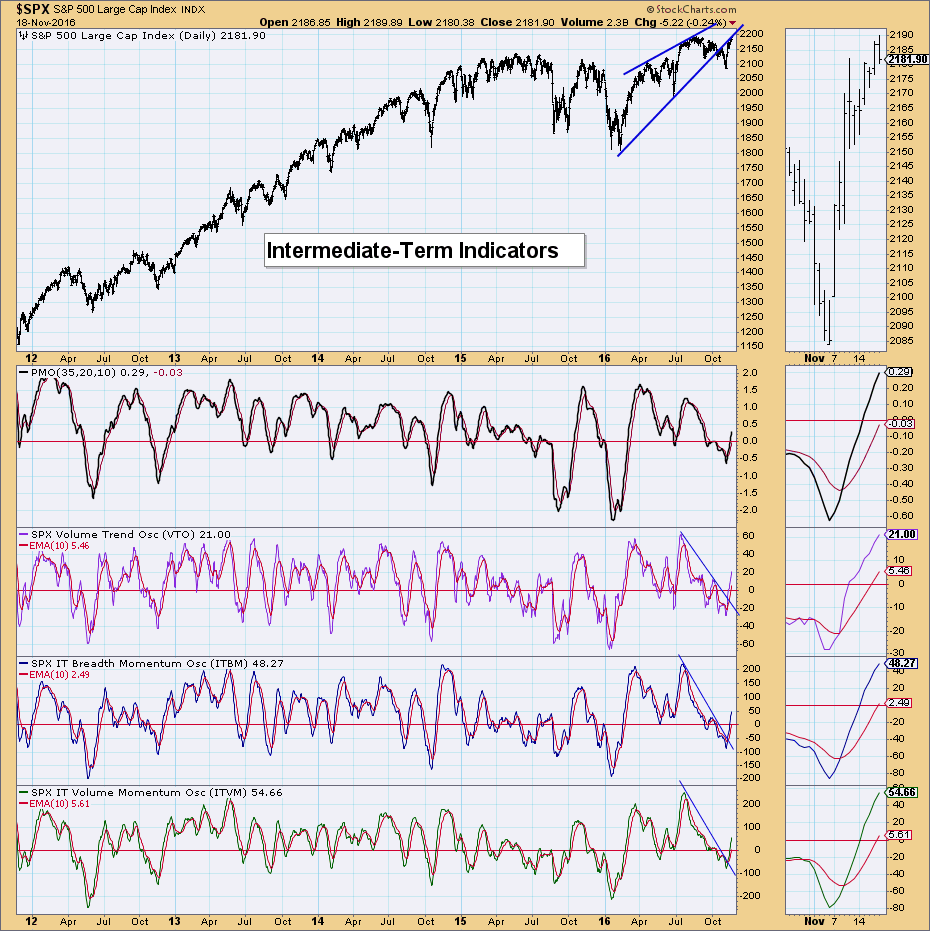
The Dow has shattered records, small- and mid-caps are doing the same. Those that have not yet reached record highs are still participating, preparing to break above all-time highs... Read More
ChartWatchers November 18, 2016 at 07:13 PM
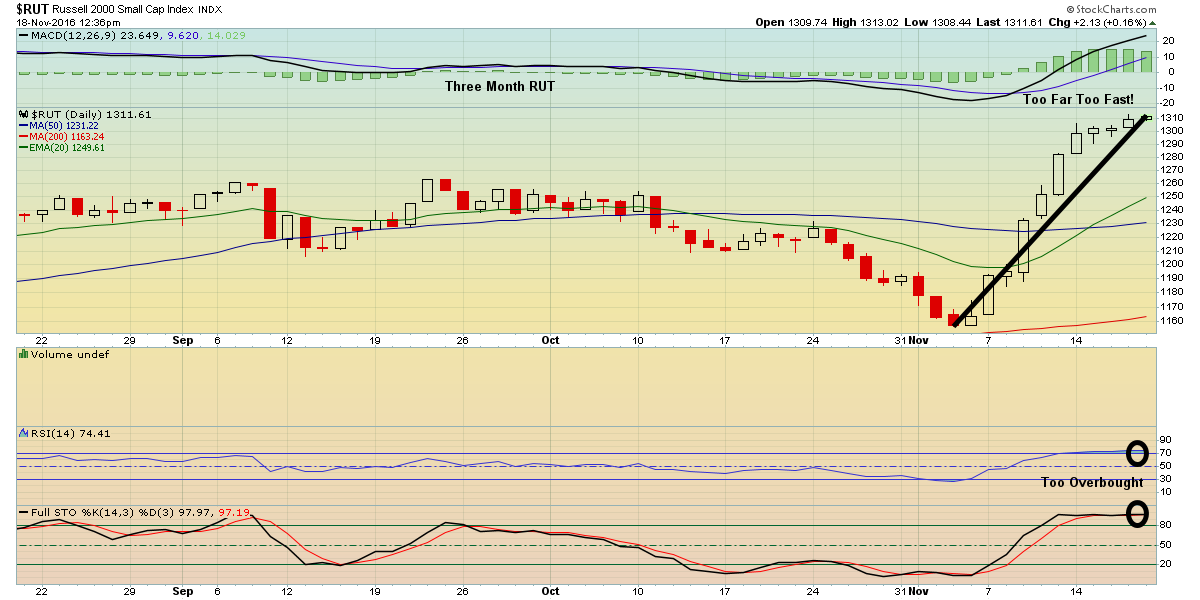
The market has been in non-stop higher mode ever since the election. The NASDAQ is up over 6%. The Dow rose 1000 points in four trading days. The small cap Russell 2000 rose over 13%... Read More
ChartWatchers November 05, 2016 at 03:30 PM
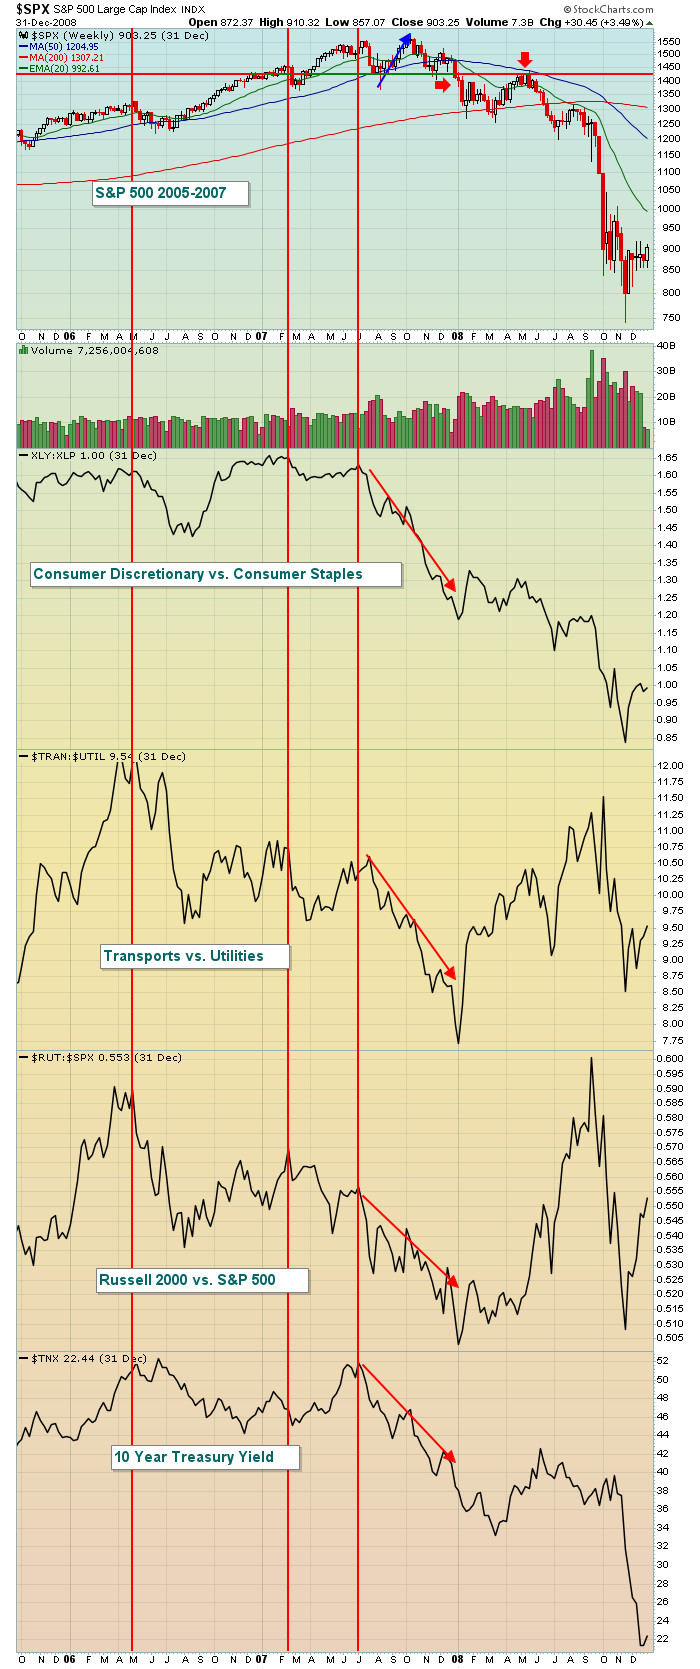
The "under the surface" signals have been quite bearish for the past 1-2 years. Money has rotated away from aggressive areas and I've discussed it here and my Trading Places blog quite often... Read More
ChartWatchers November 05, 2016 at 03:26 PM
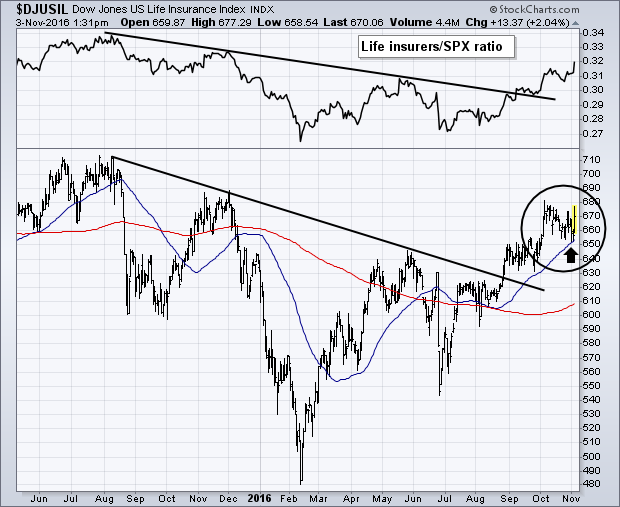
LIFE INSURERS LEAD FINANCIALS HIGHER ... Rising bond yields continue to give a boost to financial stocks like life insurers. Bear in mind that premium income in insurance stocks is invested mostly in fixed income markets. Higher bond yields mean higher income... Read More
ChartWatchers November 05, 2016 at 04:49 AM
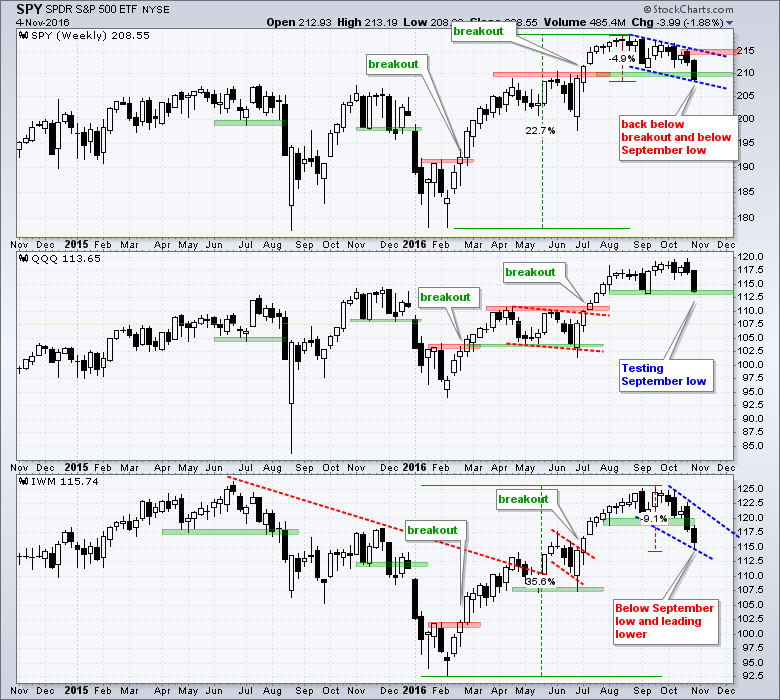
The S&P 500 SPDR (SPY) and the Russell 2000 iShares (IWM) both broke below their September lows with IWM leading the way lower. QQQ is still holding up the best because it hit a 52-week high the week before and remains above the September low... Read More
ChartWatchers November 04, 2016 at 08:02 PM
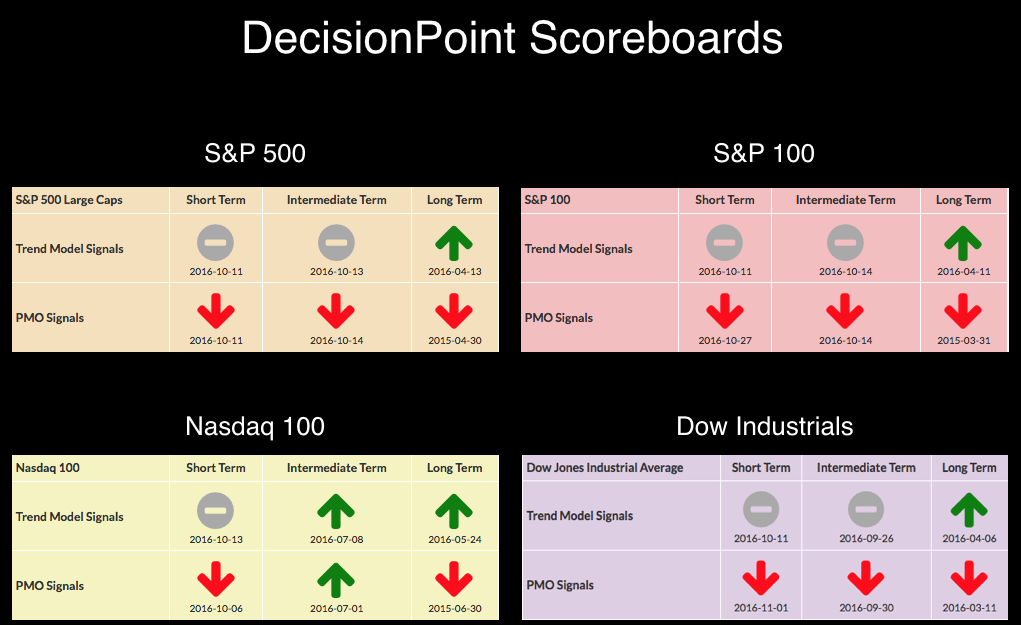
If you look at the DP Scoreboards by themselves, you would note that the NDX appears to have internal strength given that two July BUY signals are still intact in the intermediate term. However, a look at the charts reveals those signals are about to break... Read More
ChartWatchers November 04, 2016 at 05:44 PM
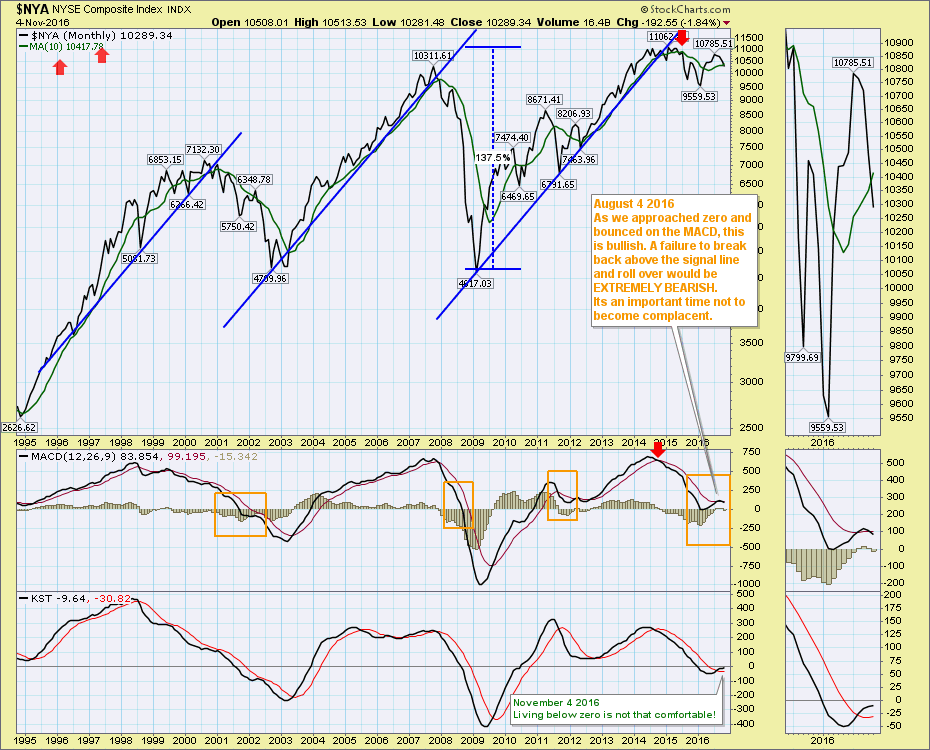
While the technicians usually write about the short tem, I want to zoom out a little and use a monthly chart of the New York Composite ($NYA). For those who follow my webinars, we are following the charts very closely as the market conditions are frail in my opinion... Read More
ChartWatchers November 04, 2016 at 01:17 PM
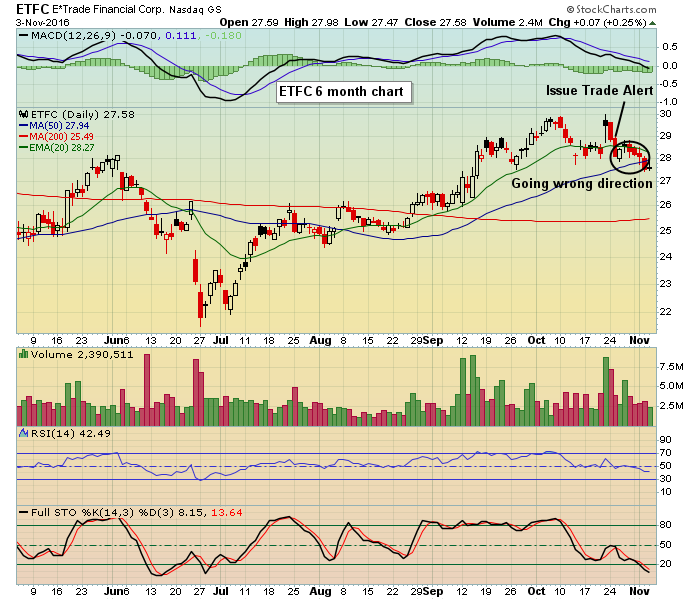
When the market is under fire like it has been for the past few weeks it becomes harder to trade successfully. This is particularly true if your focus is on the long side... Read More