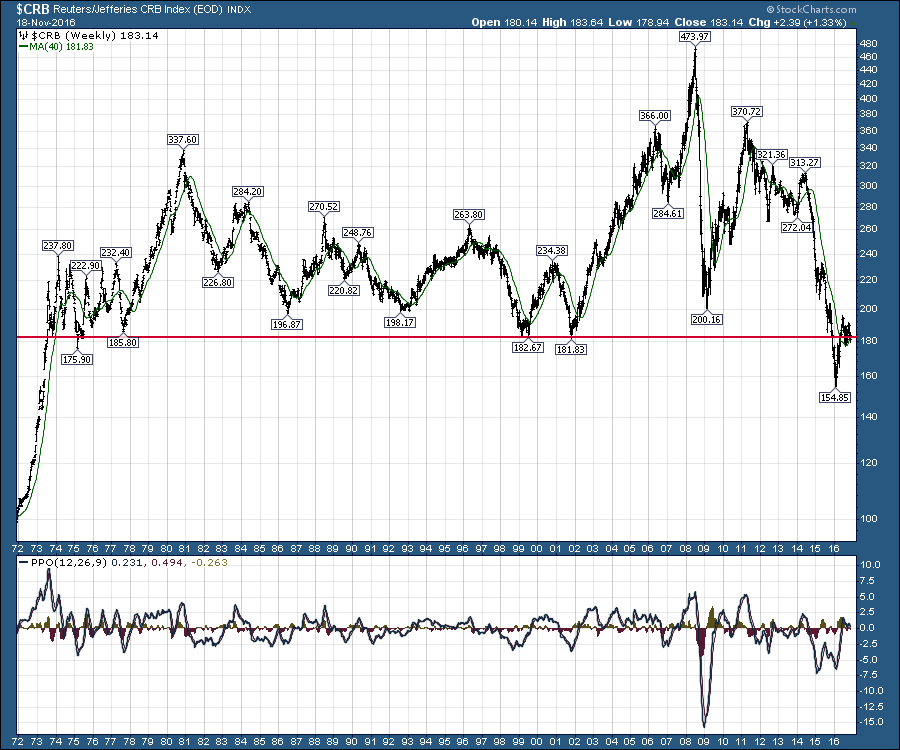
The long term chart for the $CRB continues to be a worry for technicians like me trying to understand why Commodities are having trouble staying above the 45 year trend line. Oil reached lows around $10-$12 in the 2000 period whereas now the oil low was $25. Currently oil is at $46 and this long-term commodity chart is barely holding the long term trend. The question that needs to be asked is what is changing the long-term trend in commodities that suggests the historical support level is not longer support?
With the US Dollar ($USD) rising, this typically puts more pressure on commodities. While there is lots of noise around what might or might not be correlated with the $USD, over longer time frames commodities underperform with the US Dollar as a headwind.
When the charts are making new lifetime lows for current investors, history might not be the best guide. The changes in energy supply with solar, wind and wave energy may be affecting the big picture. Nuclear, natural gas abundance, and energy efficiency are all contributing to the pressure. Even the ethanol from corn comes under pressure as the costs of other types of energy drops. With the extreme weakness in the commodity chart, something seems to be changing in the macro picture. This does not appear to be business as usual for the commodity charts. The next year could be a mystery for fundamental investors but technical investors have the best view of how the macro is changing. Buyer beware.
Investors may be better off finding other areas of the market that have high beta to invest from the long side until the dark clouds of the US Dollar clear up for commodities.
Good trading,
Greg Schnell, CMT, MFTA.

