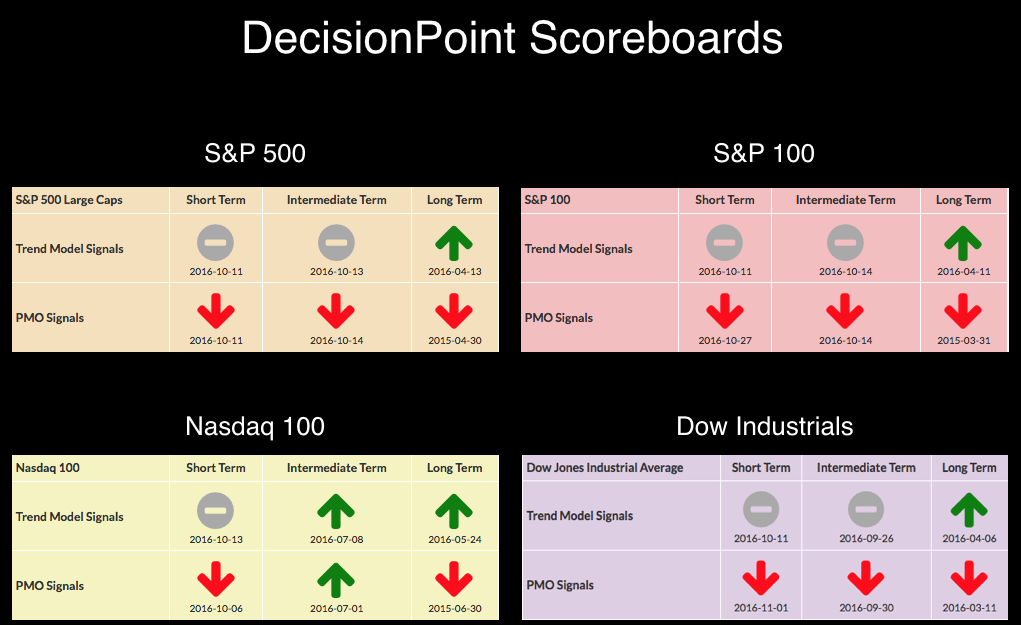
If you look at the DP Scoreboards by themselves, you would note that the NDX appears to have internal strength given that two July BUY signals are still intact in the intermediate term. However, a look at the charts reveals those signals are about to break.

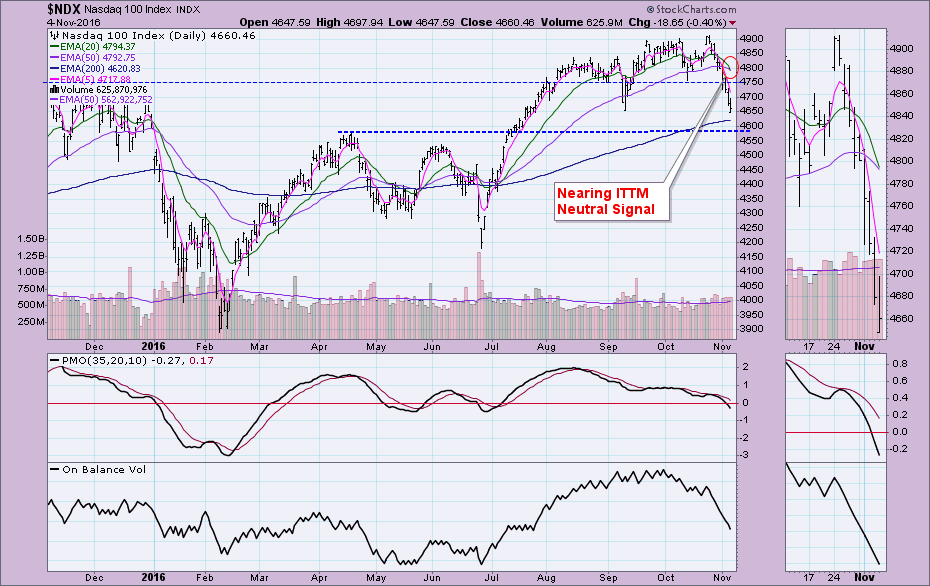
The Intermediate-Term Trend Model signals are on the daily chart. They are determined by 20/50-EMA crossovers in relation to the 200-EMA. In the case of the NDX below, you can see that an ITTM Neutral signal is likely to trigger next week.
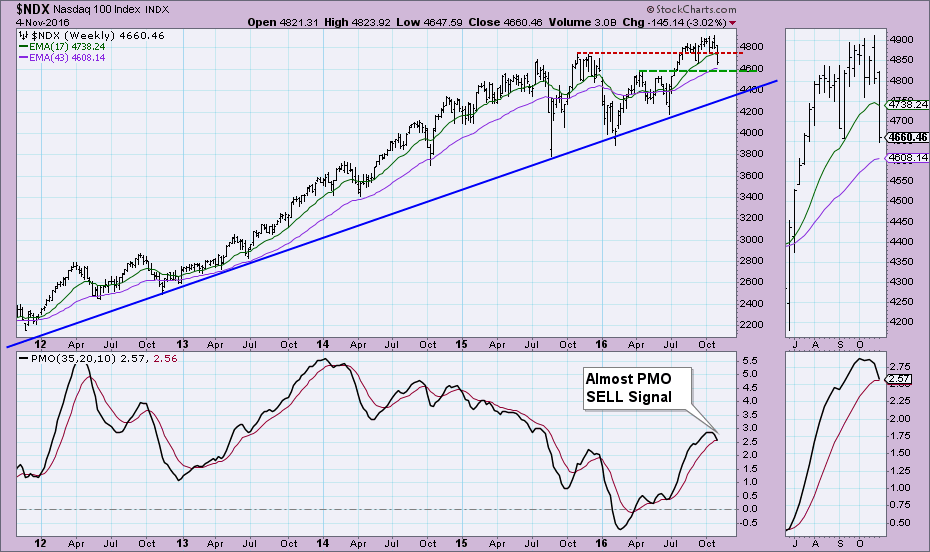
The weekly chart went final today and the NDX narrowly avoided an IT Price Momentum Oscillator (PMO) SELL signal by .01. A SELL signal will likely appear on next Friday's chart.
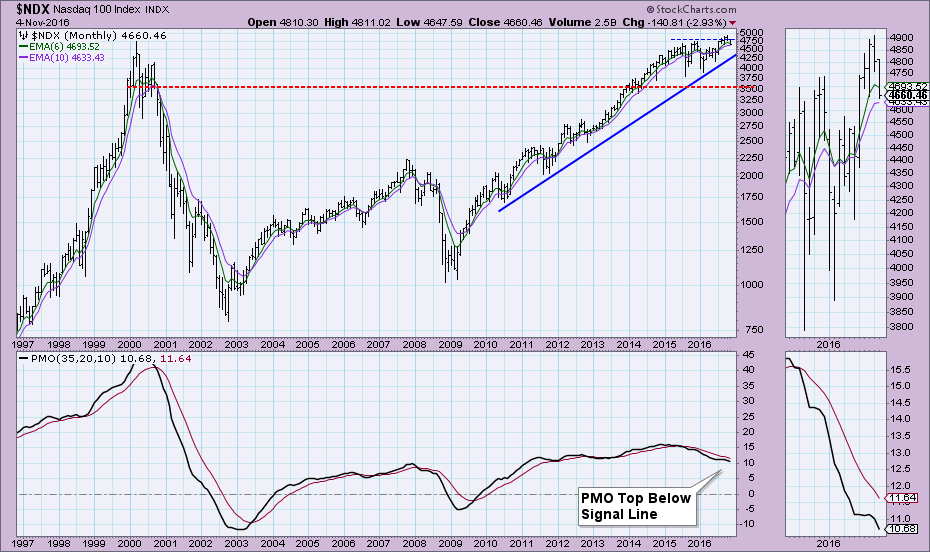
The monthly chart which the LT PMO signals are generated from shows not only a current LT PMO SELL signal but a new top below the signal line which is also quite bearish.
Conclusion: Although the DecisionPoint Scoreboard for the NDX appears bullish in the intermediate term, the weakness of the charts shows that all BUY signals in the intermediate term will be extinguished next week.
The NEW DecisionPoint LIVE public ChartList has launched! Click on the link and you'll find webinar charts annotated just before the program. Additional "chart spotlights" will be included at the top of the list. Be sure and bookmark it!
Come check out the DecisionPoint Report with Erin Heim on Wednesdays and Fridays at 7:00p EST, a fast-paced 30-minute review of the current markets mid-week and week-end. The archives and registration links are on the Homepage under “Webinars”.
Technical Analysis is a windsock, not a crystal ball.
Happy Charting!
- Erin


