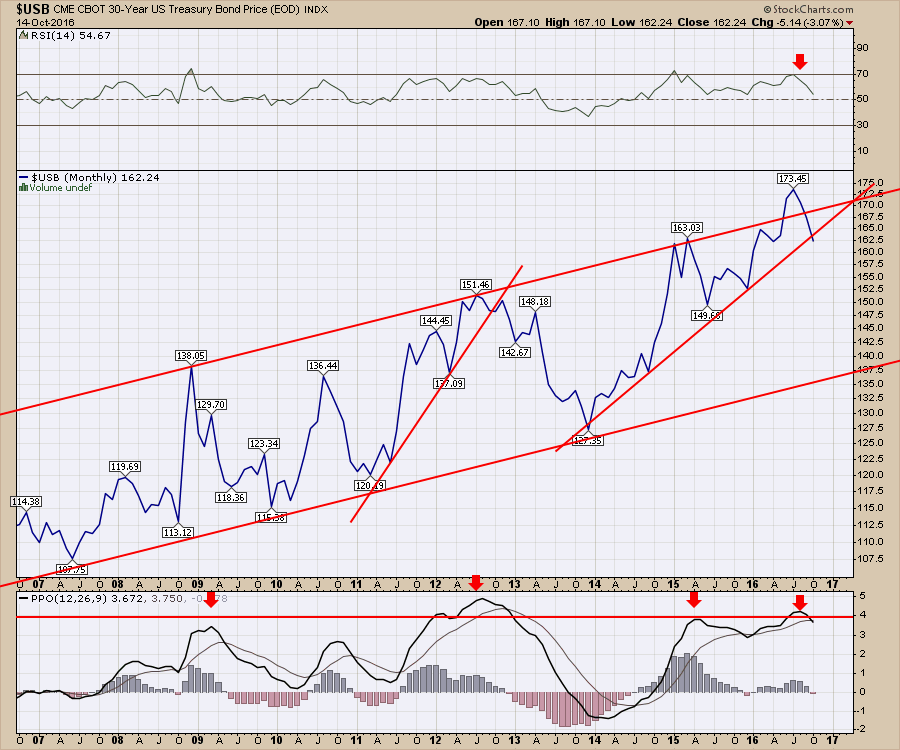
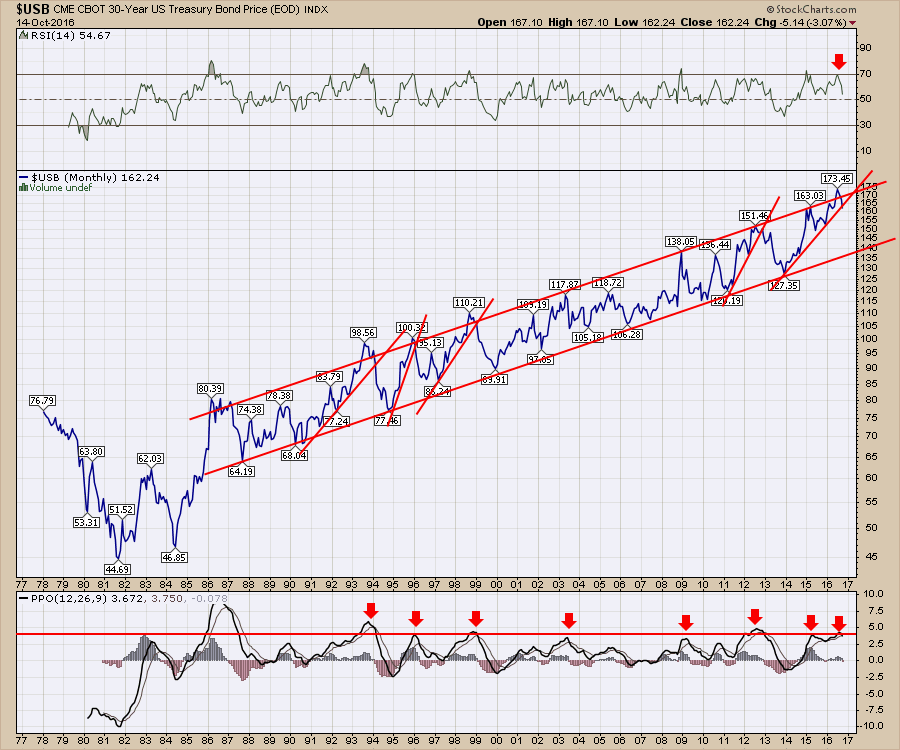
The 30-Year Bond ($USB) broke down through a long term uptrend this month but the bigger picture shows something else. There is still a major uptrend channel. However, we appear to be on a big countertrend move starting now. Interestingly, four other countertrend moves went all the way to the other side of the channel. Also of note is the PPO. It shows a rollover from the current high level so this move is just getting started.
Zooming in on the last ten years, a major rollover occured on the $USB when all the central banks applied QE at the end of 2012. This would be appear to be setup to the same extreme. However, we don't seem to have the same support for this move currently.
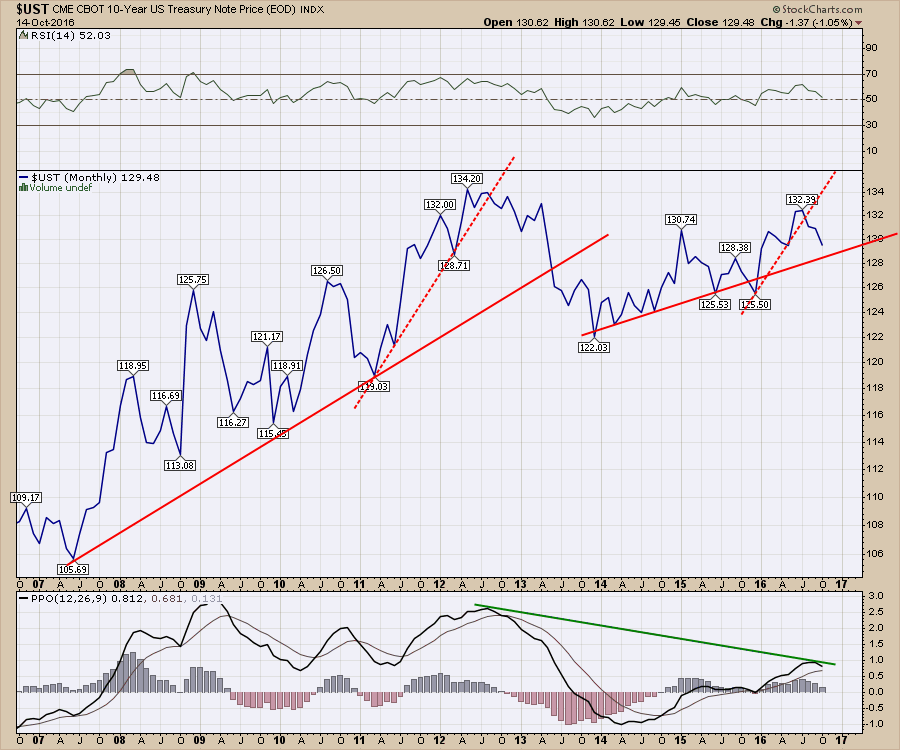
 Below is the chart of the 10 Year Treasury ($UST) price. Notice that it is starting a free fall below the dotted trendline. The PPO has a lot lower momentum than on the previous peak. Technically, this chart is well set up to move lower. There is a little support at the solid red trendline. If that does not hold, this will probably mark an extreme move down. That would confirm what the 30-Year chart above looks to be telling us.
 With the foreign currencies breaking down, it is important to watch for other significant changes. These bond charts are also breaking trend lines on the monthly charts. There are a lot of charts breaking trend lines in sympathy with these bond and currency charts. If you would like to see more about the current market setup and the litany of trend lines breaking, please follow the link to my most recent webinar. Commodities Countdown 2016-10-13 Webinar. This is an important time to be aware of the changing facades of the market.
Good trading,
Greg Schnell, CMT, MFTA.

