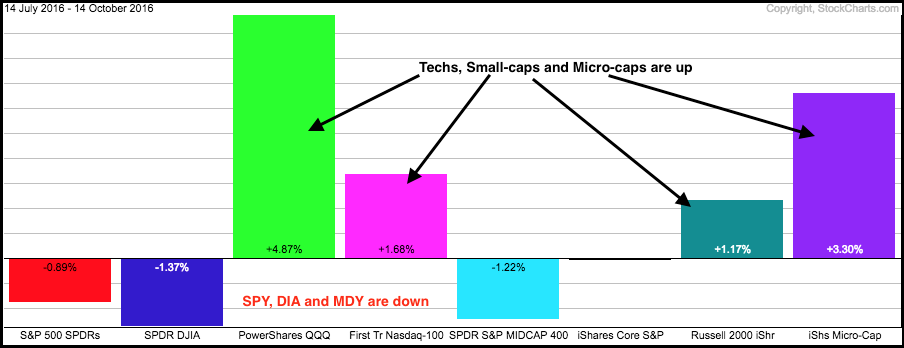
The broader market is incredibly mixed over the last three months. Even though performance divergences reflect a divided market, the major index ETFs are holding above their June highs and I view this as a correction within an uptrend. The PerfChart below shows eight major index ETFs with four up and four down. The Russell 2000 iShares, Nasdaq 100 ETF, Nasdaq 100 EW ETF and Russell MicroCap iShares are up, while the S&P 500 SPDR, Dow Diamonds, S&P SmallCap iShares and S&P MidCap SPDR are down. Basically, small-caps and techs are strong, while large-caps and mid-caps are weak.
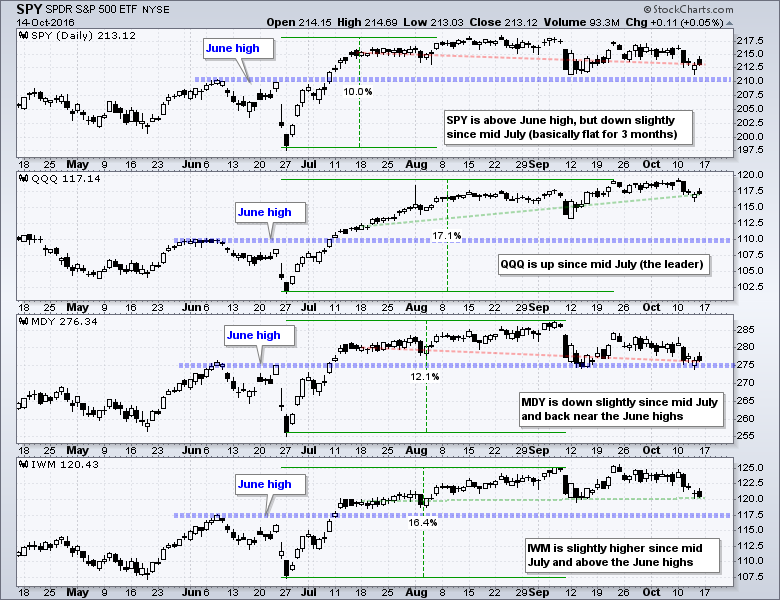
Despite this mixed performance, the four major index ETFs shown below are holding above their June breakouts. The blue dashed lines on the chart below mark the June highs. All four ETFs broke above these highs in July and hit ALL TIME highs in August-September. Not just new highs, but ALL TIME highs. Furthermore, the ETFs were up double digits on the last advance and a corrective period is perfectly normal. Also notice that QQQ and IWM led the prior charge with gains of 17% and 16%, respectively.
The bigger trend is currently up and this suggests that price action since early September is part of a corrective process. At what point does a correction turn into something more? The June highs and July breakouts might be a good place to start because a strong breakout should hold. QQQ is not even close to the June highs (blue line), but SPY and MDY are close to these breakout levels. IWM is still above the June highs. I would become concerned if/when three of the four ETFs on this chart break below their breakout levels (blue lines).
Follow me on Twitter @arthurhill - Keep up with my 140 character commentaries.
****************************************
Thanks for tuning in and have a good weekend!
--Arthur Hill CMT
Plan your Trade and Trade your Plan
*****************************************


