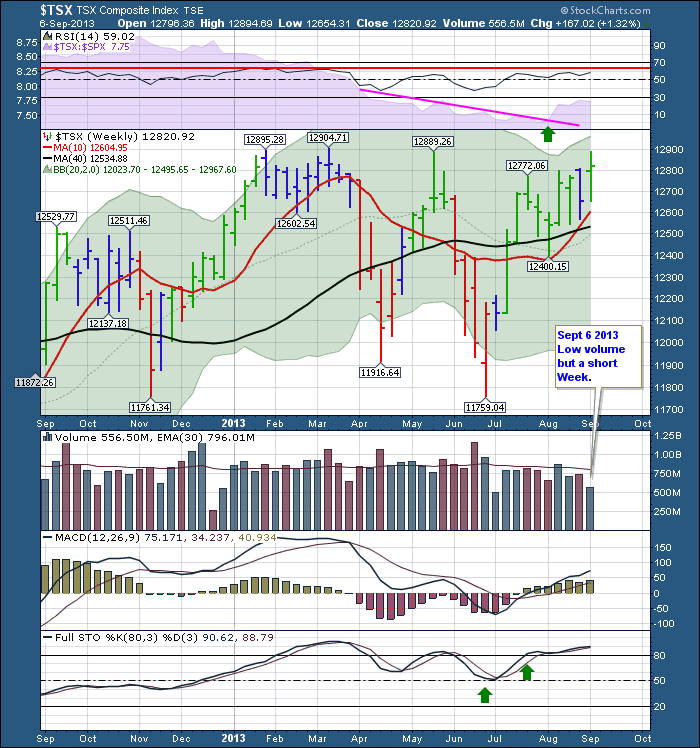
The $TSX has tried to move above the 12900 level a few times this year. We are approaching it again.
Here is the live link to the $TSX Chart. The unfortunate part about this $TSX chart is it looks extremely similar to this link of the year 2000 chart of the $SPX relative to previous highs.
The June low is the only thing that makes this look worse than the $SPX 2000 chart. A series of tests at the highs with multiple tests of the 40 WMA below before failing. However there are some strong positives.
This one year view has a couple of major positives going on. For the first time in a long time the $TSX has outperformed the $SPX for 4 weeks as shown on the SPURS in purple behind the RSI chart.
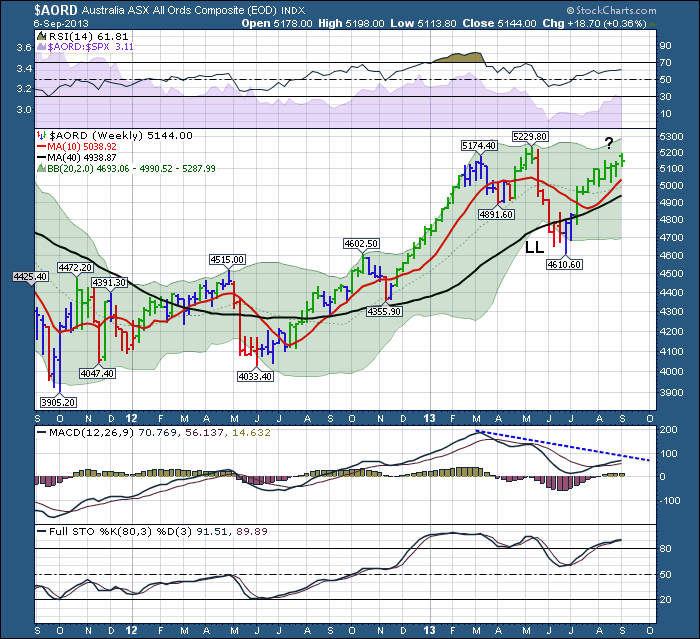
The RSI has not broken out into a new bull trend (above the red line) yet, but this could happen soon. The 10 WMA is above the 40 WMA, and the 20 WMA is just below. If the 10 WMA and the 20 WMA can both move above and hold above the 40 WMA over the next 2 weeks, we'll confirm a bullish upside breakout. I would like to see the $FTSE, the $DAX and the $AORD move above May highs to confirm the breakout. The $TSX price chart has made a series of lower highs currently and a lower low in June which is the definition of a downtrend, so I am apprehensive here. This weeks test of 12889 was taken out intraday but so far, failed to hold. Currently, the $AORD (Australia Index) has also made a lower low, and not a higher high (yet!) as you can see below. Click here for the live link to the Aussie chart.
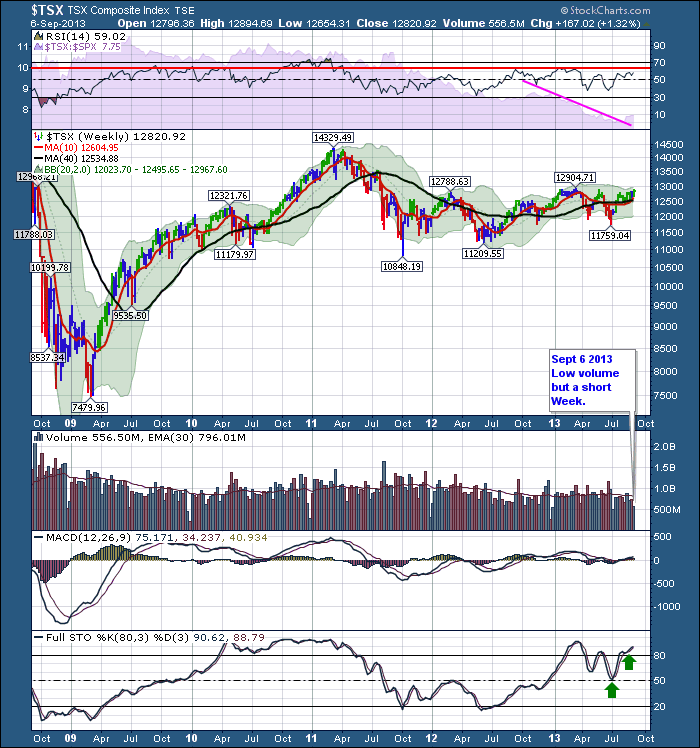
The LL indicates the lower low. I plan to keep watching for the confirmation from the two major commodity countries. I would be thrilled if we could break out of this 2 year $TSX base that you can see below. Here is the 5 year view of Canada.
You can see how frustrating it has been to hold Canadian equities. This would be a considerable breakout that would be very very bullish, especially with global confirmation. The Full sto's have stayed above 50 all year, so maybe this is finally the big breakout. Last fall we moved above the 12500 level as the full sto's moved above 50 and that looked to be the big breakout. Unfortunately we stalled at 12900 with a lower high in May and a lower low in June. Recently we pushed the full sto's above 80 where it can stay for a long time. This does not mean overbought but a good strong uptrend with these long period settings on a weekly chart.
Conversely, if the breakout does not hold, I would be very bearish in short order if Canada and the global markets mentioned fail at former resistance levels. Stay tuned!
Looking forward to seeing investors in NYC. We'll have a great market presentation including intermarket analysis by John Murphy. Couldn't come at a better time. The major downturns on the $SPX started September 1, 2000 and October 9 2007. The next month marks another 6 year cycle from the 2007 high to current highs. We'll have more cycle work on that in NYC as well. Not just courses but some current market analysis thrown in for good measure! Hope to see you there!
Good trading,
Greg Schnell, CMT


