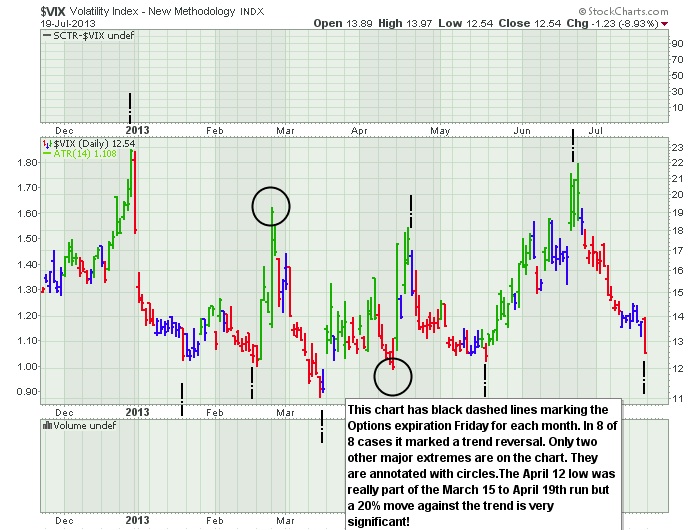
Notice the price action on the $VIX. The peaks and valleys are 100% apart!
The monthly options expiration date has marked a significant turning point for the $VIX every month for at least 8 months.
I have marked the OE day with a black dashed line. The circles represent 2 major turns that were not associated with OE.
So being aware of the price action coming into and leaving the OE date can be very important for short term traders.
Currently we appear to be near recent lows. We also have made 3 higher lows in a row. We'll see if that trend changes in the next few weeks.
Globally, I think watching the foreign market charts will tell us where the markets are going next.
This is Asia below.
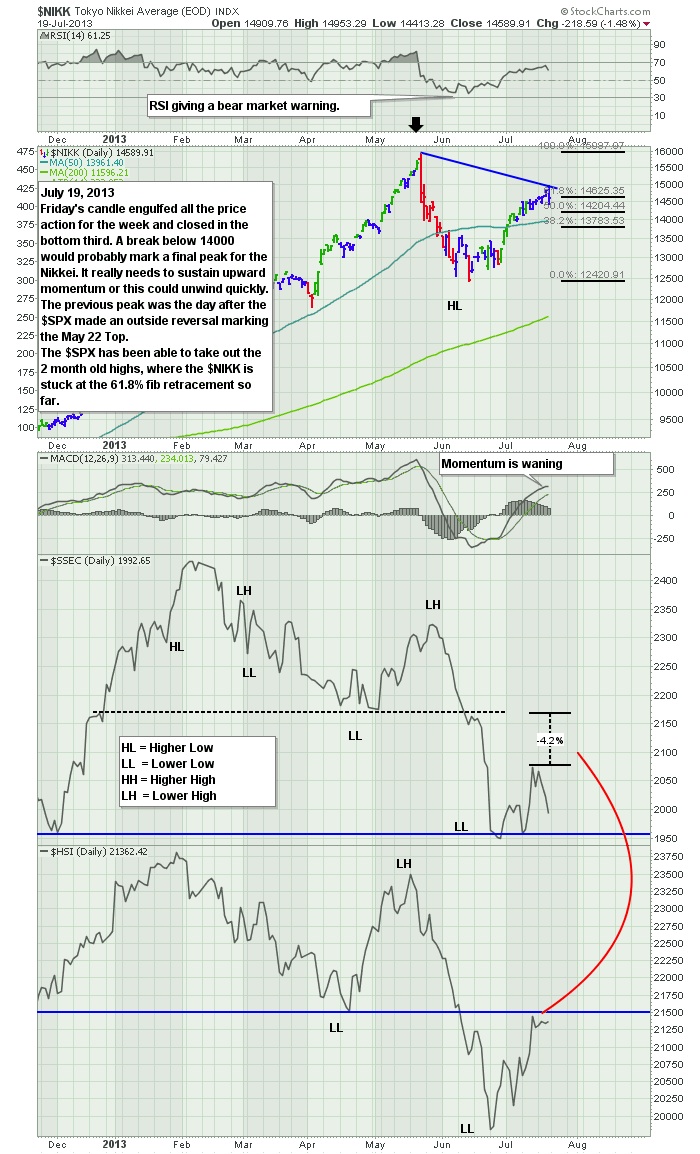
The Nikkei has been one of the most volatile markets in the world. It soared 100%, pulled back over 20% and
is now trying to push higher. The real problem is the momentum. The strong momentum has been lost here. Notice how all these markets have faired
since the May 22 high on the $SPX. The $NIKK can't seem to get back up and closed the week at a 61.8% retracement of the move. It also
had an engulfing candle on Friday which covered the entire range of the week. It closed in the bottom third which is bearish.
You can see the RSI has given off a bear market warning signal (RSI below 40) and is now testing the high side of the range.
The MACD is showing the slowing momentum.
Notice how the $SSEC (Shanghai) is a full 4% behind the $HSI (Hong Kong)on the retracement move. The $HSI finds itself at resistance.
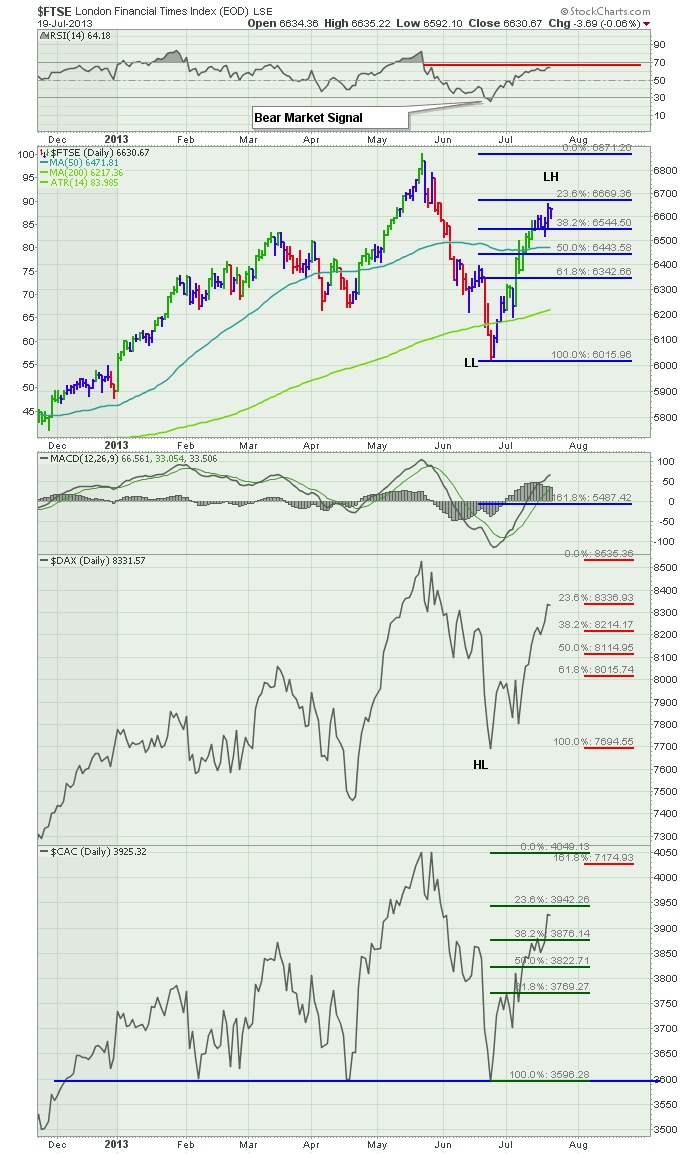
For Europe, the charts couldn't get more interesting. The elder statesmen technicians will tell you to watch the $FTSE
to see if it starts making lower highs. That usually precedes the $SPX.
The $FTSE has made a lower low (LL), the $DAX has made a higher low (HL) and the $CAC has tested the 2
previous lows exactly! All of them have retraced the same amount of the move down in percentage terms unlike the
Asian markets above. The $FTSE RSI has given a bear market signal by going below 30. It is weak. Now can it get back above 70?
It should be an interesting month. July marked the top of the big $SPX pullback in 2011 amidst the commodity weakness.
We currently have the commodity weakness. The global markets are softer than the USA. I think it will be very important for the $FTSE
and $DAX to make new highs here. The long term $FTSE chart would look like a failed double top compared to the 2007 highs.
The $CAC is still below 2011 highs. The $DAX is the strongest market in Europe with the chart well above the 2007 high.
Good trading,
Greg Schnell, CMT


