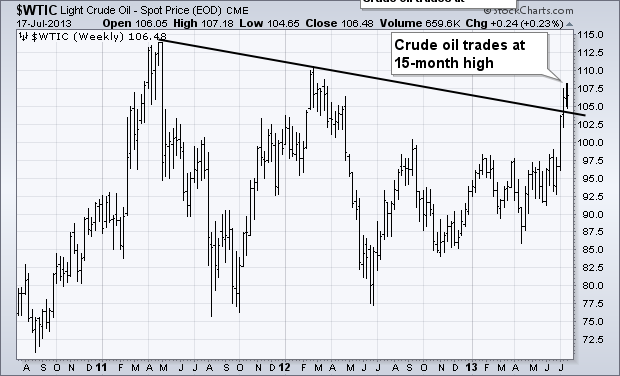
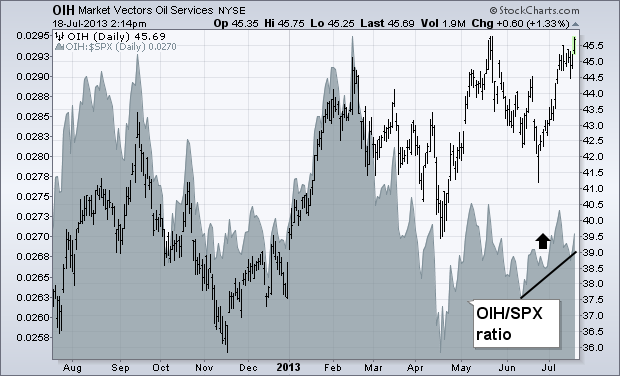
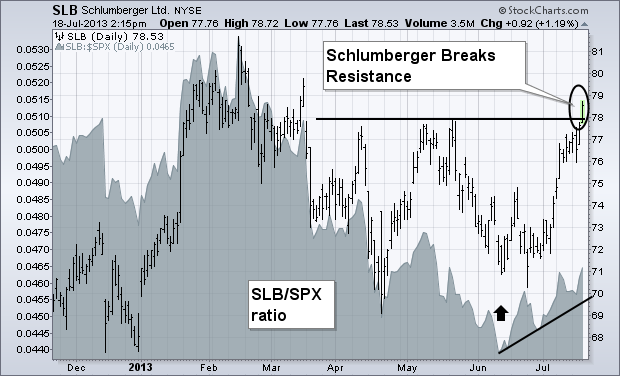
Chart 1 shows Light Crude Oil trading at the highest level in fifteen months. My July 5 message showed crude oil trading higher in an attempt to close the gap between it and higher priced brent crude. As of today, crude is only a dollar away from its European counterpart. With oil prices on the rise, investors appear to be showing new interest in energy stocks. My July 8 message showed the Market Vectors Oil Services ETF (OIH) moving up toward its 2013 highs. Chart 2 show the OIH very close to challenging its May peak. Its relative strength ratio (gray area) has also started to climb since June. That same message showed upside breakouts in Baker Hughes (BHI) and National OIlwell Varco (NOV). Today's upside breakout belongs to Schlumberger (SLB). Chart 3 shows SLB trading over its spring high with a rising relative strength ratio. SLB is also the largest holding in the OIH.


