ChartWatchers July 22, 2012 at 05:41 PM
Hello Fellow ChartWatchers! At StockCharts.com, we go to great lengths to make sure that our indicator values are calculated correctly as discussed in that article... Read More
ChartWatchers July 21, 2012 at 04:00 PM

I know many traders view the MACD to be a lagging indicator and technically it is. After all, the calculation of the MACD uses historical price data so how could it not be a lagging indicator? Well, I can only tell you that I use the MACD for advanced calls quite a bit... Read More
ChartWatchers July 21, 2012 at 03:52 PM
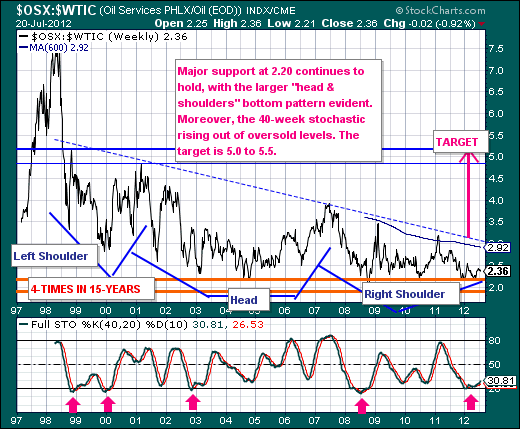
The current market environment is rather difficult to be sure; but the moving of the chess pieces underneath the market surface is what interests us at present. We are focused upon the Energy Sector (XLE) in general, and the Oil Services Group (OSX) in particular... Read More
ChartWatchers July 21, 2012 at 03:47 PM
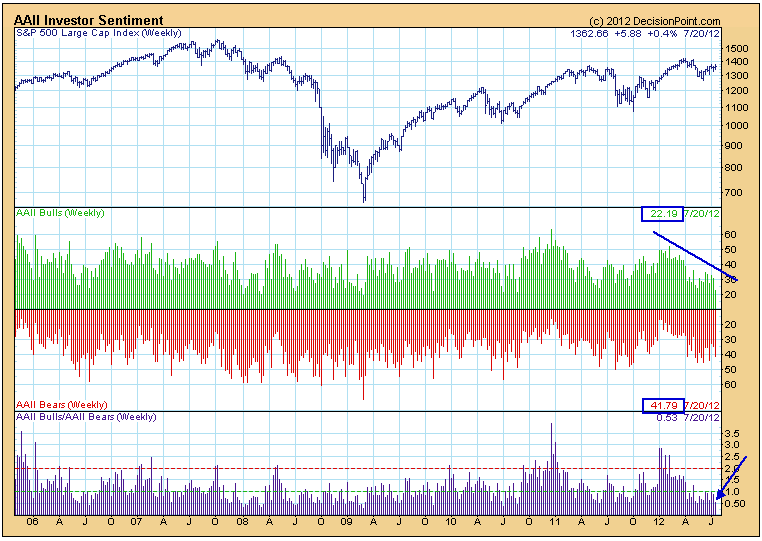
Last week the Rydex Ratio was displaying very bullish sentiment, and that is still the case. In rather stark contrast AAII Investor Sentiment* (American Association of Individual Investors) reflects very bearish sentiment this week, with 22% bulls and 42% bears... Read More
ChartWatchers July 21, 2012 at 03:39 PM

Currency trends often us something about the mood of global traders, and which way they're starting to lean. In the ongoing battle between "risk-on" and "risk-off" trades, one of the markets worth keeping an eye on is the Australian Dollar... Read More
ChartWatchers July 21, 2012 at 09:25 AM
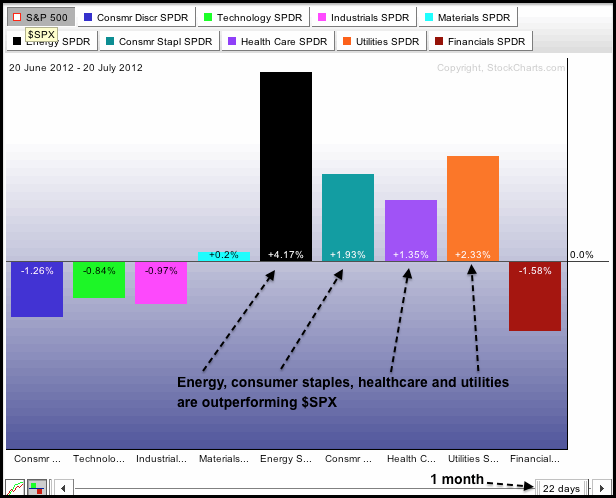
The first chart shows the S&P Sector PerfChart for the one month time frame (22 trading days) and the second chart shows the three month timeframe (64 trading days)... Read More
ChartWatchers July 08, 2012 at 08:24 AM
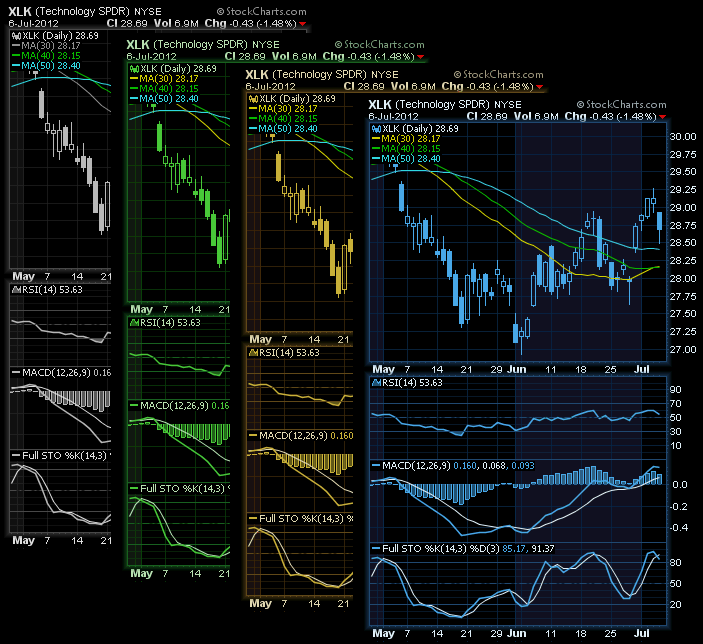
Hello Fellow ChartWatchers! I'm pleased to announce that we have just added 4 new color schemes to our charting workbench. These schemes are specifically designed for people that like light colored charts on black backgrounds... Read More
ChartWatchers July 07, 2012 at 02:19 PM
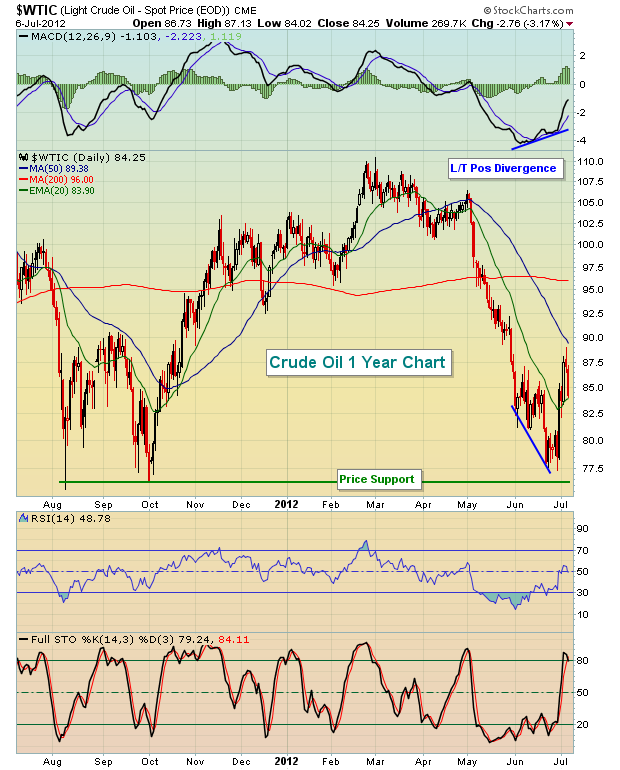
Reasonably bullish signs have emerged, the latest being that crude oil prices (finally!) found support at 2 year lows near $76-$77 per barrel. Not only was price support tested, but slowing momentum was obvious in the form of a long-term positive divergence... Read More
ChartWatchers July 07, 2012 at 02:16 PM
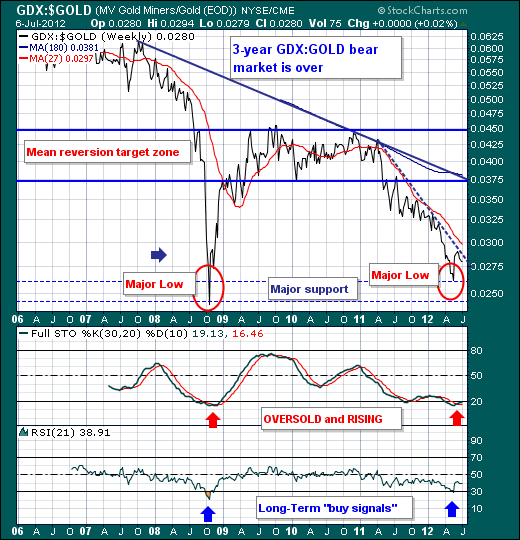
Gold prices are trapped we are afraid; and they are trapped between the $1584 and $1646 levels - of which the lower boundary is the 20-month moving average; while the upper boundary is the 30-week moving average... Read More
ChartWatchers July 07, 2012 at 02:14 PM
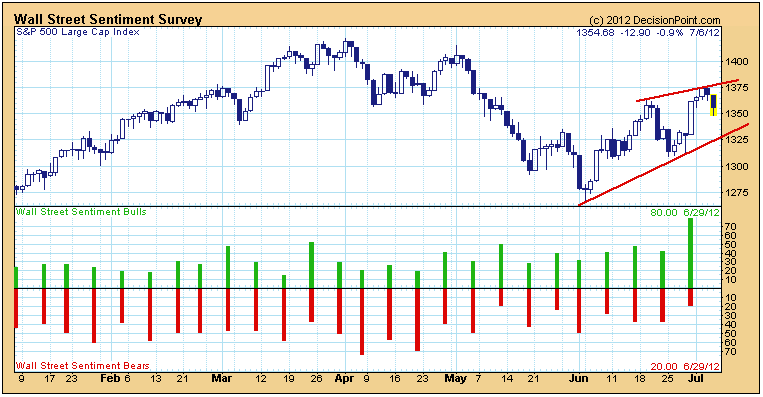
The Wall Street Sentiment Survey* is unique in that the poll is taken on Friday after the market closes, and it asks participants for their forecast for the following week... Read More
ChartWatchers July 07, 2012 at 02:12 PM
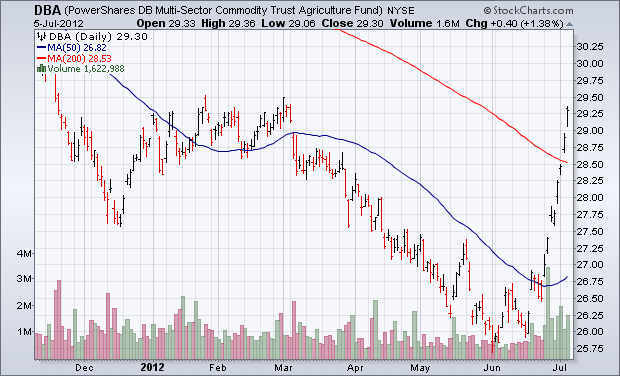
Agricultural commodities have been on a tear over the last month. Chart 1 shows the Power Shares Agricultural Fund (DBA) in a parabolic rise since mid-June. Most of that surge is coming from grain markets as the result of drought conditions in the midwest... Read More
ChartWatchers July 07, 2012 at 04:16 AM
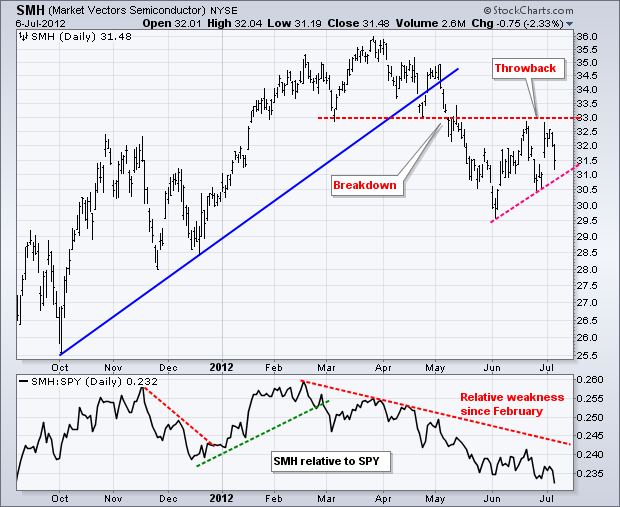
Relative weakness in the **Networking iShares (IGN)** and the **Market Vectors Semiconductor ETF (SMH)** weighed on the technology sector this week. The chart below shows SMH breaking down in May and then bouncing back to broken support in mid June... Read More