I know many traders view the MACD to be a lagging indicator and technically it is. After all, the calculation of the MACD uses historical price data so how could it not be a lagging indicator? Well, I can only tell you that I use the MACD for advanced calls quite a bit. Recently, when crude oil was plummetting, it flashed a long-term positive divergence and VOILA! prices rebounded. You can check out my last article to see the lower crude oil prices accompanied by a higher MACD reading. The interesting part is whether the positive divergence means the selling has ended for a long period of time or just temporarily. In my opinion, the long-term divergence tells you that momentum has slowed in the direction of price TEMPORARILY. We must await additional technical signs that a more significant bottom has formed.
Let me give you a recent example. Take a look at the positive divergence that formed on Mosaic (MOS):
This chart is almost a picture perfect example of what I look for. First, note the hammer that formed on the bottom as the long-term positive divergence printed. That reversing candlestick adds to the bullishness of the technical picture. Second, once the rebound begins, I look for a move toward the 50 day SMA (point 1 on the chart), then a higher low (point 2 on the chart) before a breakout move to confirm the bottom is in. Since that pattern, MOS has been in a very bullish uptrend.
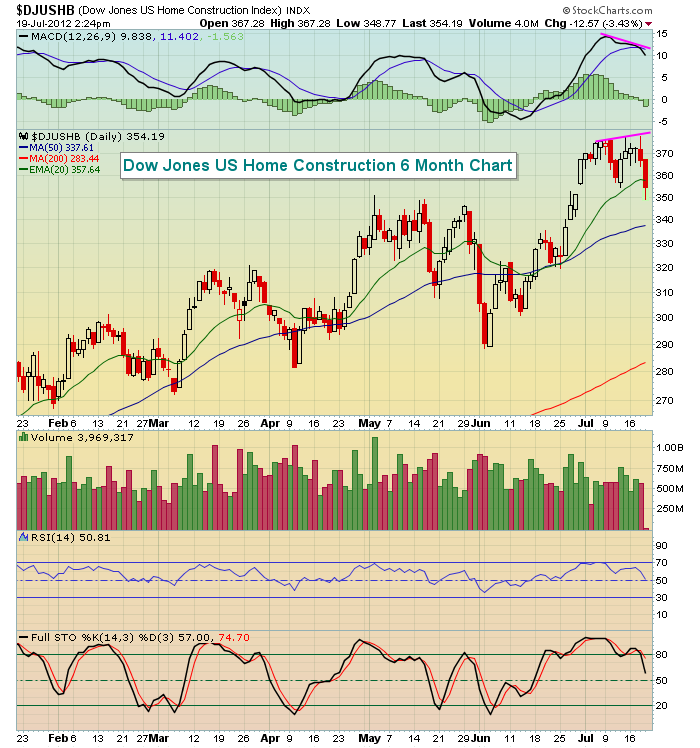
A long-term negative divergence can do the same thing, only in reverse. Once a negative divergence prints, I look for that 50 day SMA test and then see how the stock reacts. There are few areas of the market where I've seen long-term negative divergences, but the home construction area is close. Check out this chart:
Technically, a negative divergence hasn't printed because we don't have a higher CLOSE to accompany the lower MACD. The recent highs were intraday highs and do not create the negative divergence. Remember that MACD's are calculated on closing prices, not intraday prices. But what this chart tells me is that if home construction moves to a new closing high, we should be on the lookout for a potenial near-term top, possibly more. But we'll let the technical action after the divergence forms answer that question for us.
Happy trading!
Thomas J. Bowley
Chief Market Strategist
Invested Central


