ChartWatchers June 30, 2011 at 09:59 AM
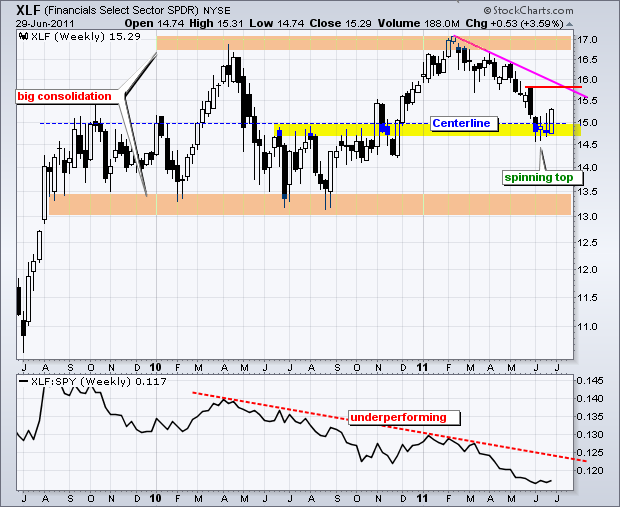
The Finance SPDR (XLF) has been on a road to nowhere for almost two years now. After first moving above 15 in September 2009, the ETF embarked on a long trading range with support near 13 and resistance near 17... Read More
ChartWatchers June 18, 2011 at 10:19 PM
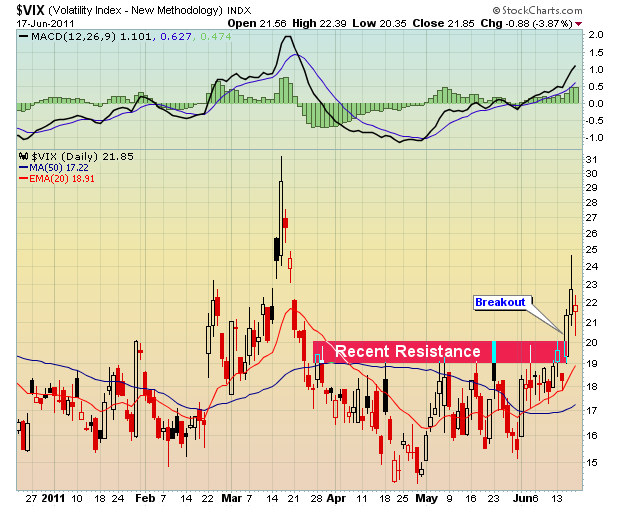
Traders are expecting the horrible market we've seen thus far in June to only get worse. The VIX is the ticker symbol for the Chicago Board Options Exchange Market Volatility Index... Read More
ChartWatchers June 18, 2011 at 09:00 PM
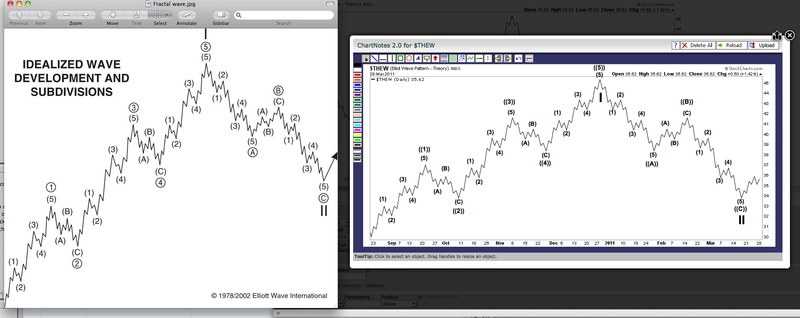
There are several new indexes at StockCharts.com that everyone should check out... Read More
ChartWatchers June 18, 2011 at 03:58 PM
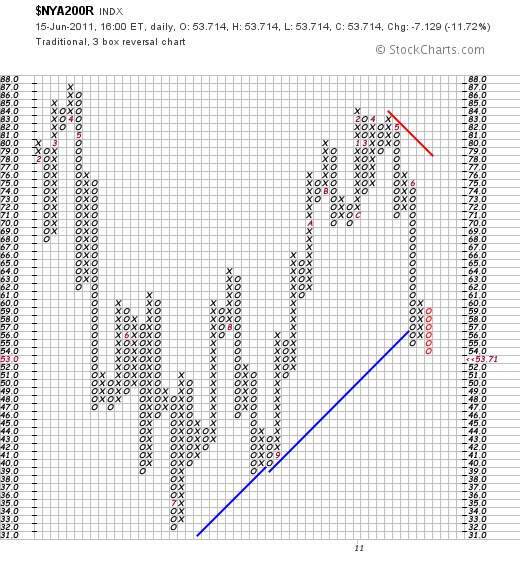
Last Thursday's message showed the point & figure version of the % NYSE stocks above their 200-day moving average in a downside correction. I suggested that the first sign of improvement would be a three-box reversal to a rising X column... Read More
ChartWatchers June 18, 2011 at 03:36 PM
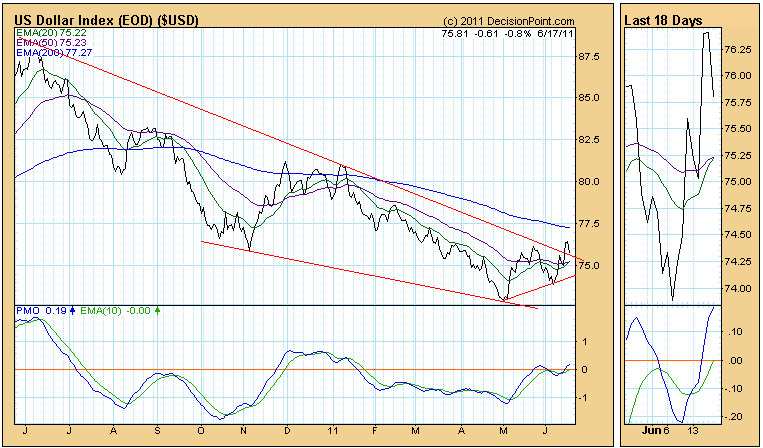
While the U.S. Dollar Index didn't do so well Friday, it is getting ready to generate a Trend Model buy signal. Note on the chart below that the 20-EMA is less than a hair away from crossing up through the 50-EMA, which will mechanically generate the buy signal... Read More
ChartWatchers June 18, 2011 at 11:31 AM
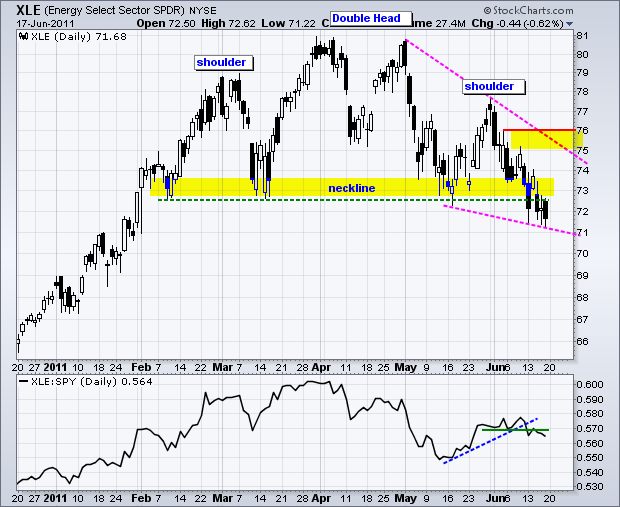
The Energy SPDR (XLE) has been one of the weakest sectors this month. In fact, the chart shows XLE breaking support from a large Head-and-Shoulders reversal pattern. The left shoulder peaked in March, the head peaked in April and the left shoulder peaked at the end of May... Read More
ChartWatchers June 05, 2011 at 04:26 PM
IMPROVEMENTS TO PREDEFINED SCAN RESULTS - We've been hard at work improving our predefined scan results page so that you can quickly see which scans have had the biggest improvements over the course of the past day... Read More
ChartWatchers June 05, 2011 at 03:36 PM
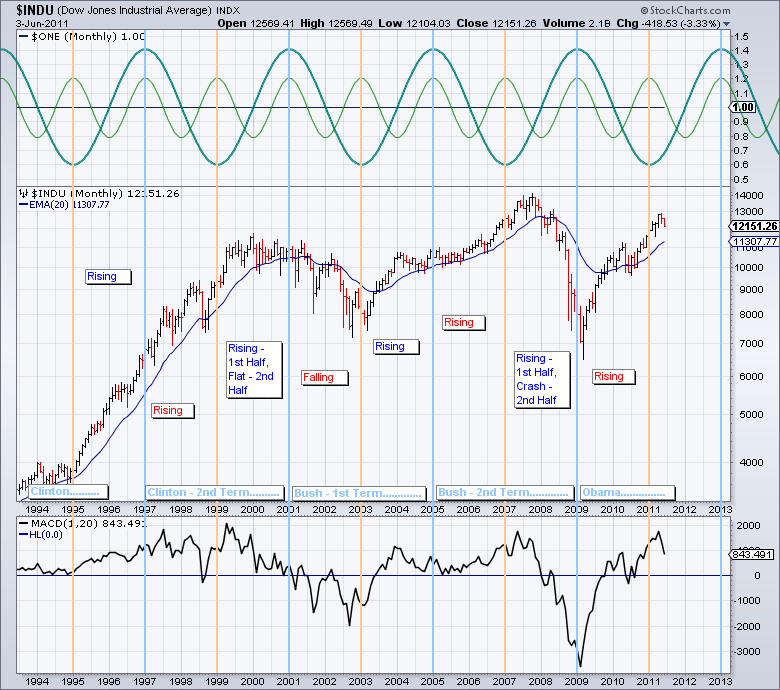
Hello Fellow ChartWatchers! Recently we introduced a new cycle analysis tool in our ChartNotes annotation tool - the Cycle "Sine Wave" tool. This tool helps you look at various period cycles on your charts... Read More
ChartWatchers June 05, 2011 at 02:33 PM
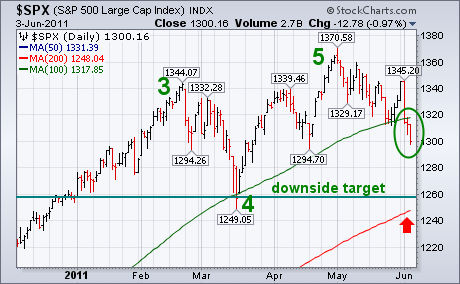
Thurday's message showed the S&P 500 threatening two important support lines. Unfortunately, both have been broken. Chart 1 shows the SPX closing below its 100-day average (green line) for the first time since last August... Read More
ChartWatchers June 05, 2011 at 02:29 PM
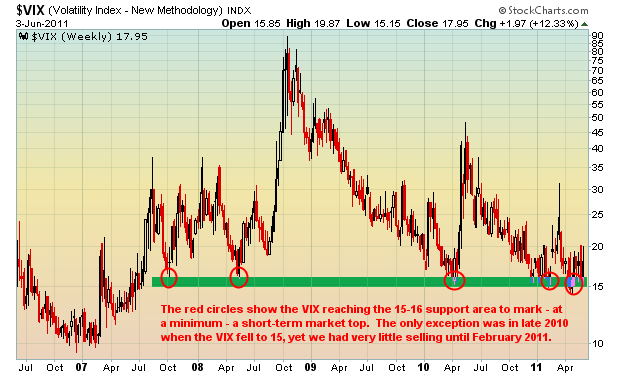
There are many sentiment indicators that can be followed but the two I most closely follow are the Volatility Index (VIX) and the Equity Only Put Call Ratio (EOPCR). There are sentiment gauges that tell you how investment letter newswriters "feel" about the market... Read More
ChartWatchers June 05, 2011 at 02:25 PM
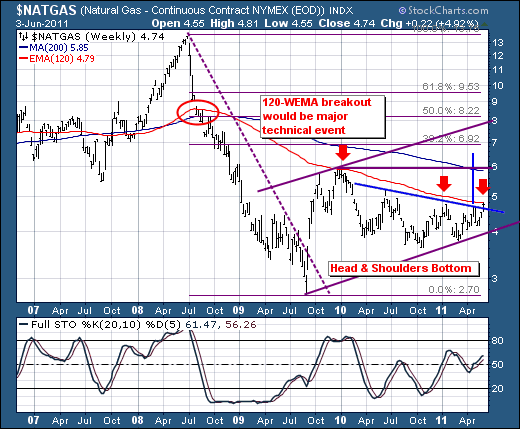
In the past 10-months, the commodity markets have rallied rather substantially on the back of the QE-2 campaign... Read More
ChartWatchers June 05, 2011 at 02:18 PM
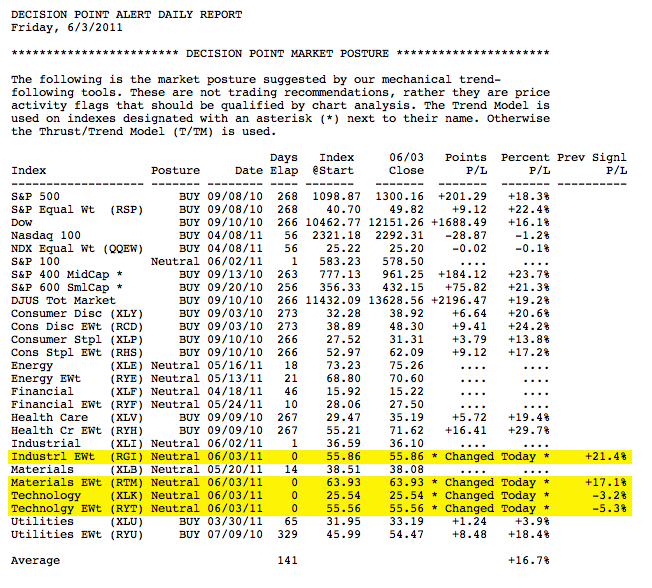
For over three months the market has been chopping around and making very little progress. In the process internals have been weakening, a fact that is reflected in the signal table below... Read More
ChartWatchers June 04, 2011 at 05:45 AM
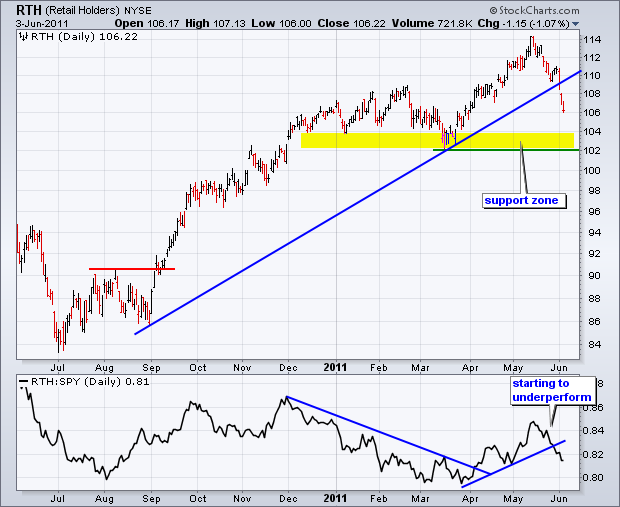
With economic indicators and employment statistics coming up short this week, retail stocks came under considerable selling pressure. Led by weakness in Wal-Mart and Home Depot, the **Retail HOLDRS (RTH)** is down some 7% the last few weeks... Read More