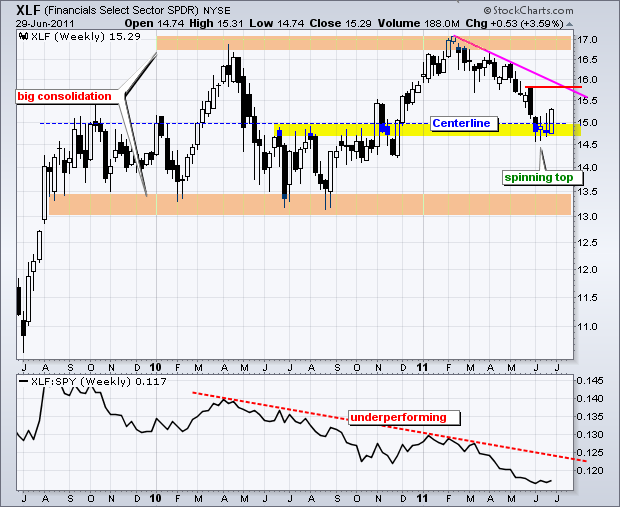
The Finance SPDR (XLF) has been on a road to nowhere for almost two years now. After first moving above 15 in September 2009, the ETF embarked on a long trading range with support near 13 and resistance near 17. XLF has crossed the mid point (15) at least 10 times since September 2009. Even though the ETF closed below 15 at the beginning of June, a pair of indecisive candlesticks formed the next two weeks and the ETF bounced off support in late June. Support stems from broken resistance (yellow highlight).

Click this image for a live chart.
This could be a big moment for the beleaguered sector. XLF has been underperforming the S&P 500 since August 2009. The indicator window shows the Price Relative (XLF:SPY ratio) zigzagging lower with a new low recently. Relative weakness is not a good sign. Turning back to the chart, the ETF established short-term support at 14.50 over the last four weeks. This is the level that must hold. A break below 14.5 would open the door to support in the 13-13.50 area. On the upside, the February trendline and late May high mark an important resistance hurdle. A breakout here would be quite positive and open the door to an assault on the 2010-2011 highs.
