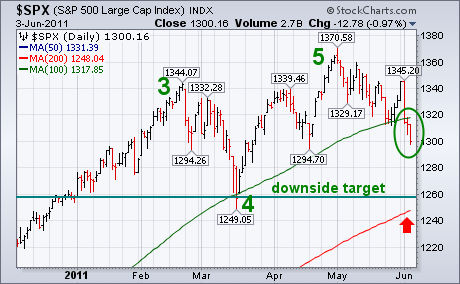
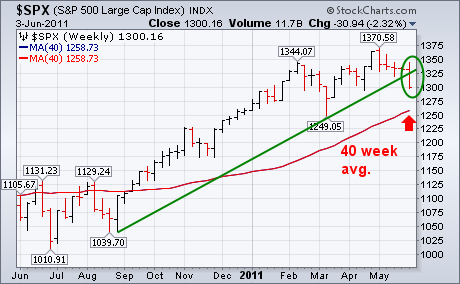
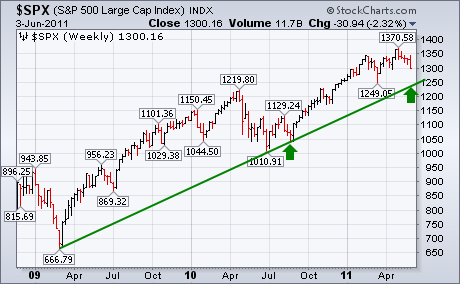
Thurday's message showed the S&P 500 threatening two important support lines. Unfortunately, both have been broken. Chart 1 shows the SPX closing below its 100-day average (green line) for the first time since last August. The weekly bars in Chart 2 show the SPX ending well below an up trendline drawn under its August/March lows. Those downside violations leave little doubt that the market has entered a downside correction. The most logical downside target at this point is a drop to the March low near 1250 which also happens to coincide with the 200-day (40-week) moving averages which are the red lines in the two charts. There are at least three reasons why the March low is so important. First, it's the next major support level (and represents the bottom of Wave 4 in an Elliott Wave sequence). Second, it coincides with the 200-day moving average which is a major support line. Chart 3 shows another reason. The 1250 level represents a test of a two-year up trendline drawn under the 2009/2010 lows (see arrows). That means that prices need to stay above that level to keep the two-year bull market intact.


