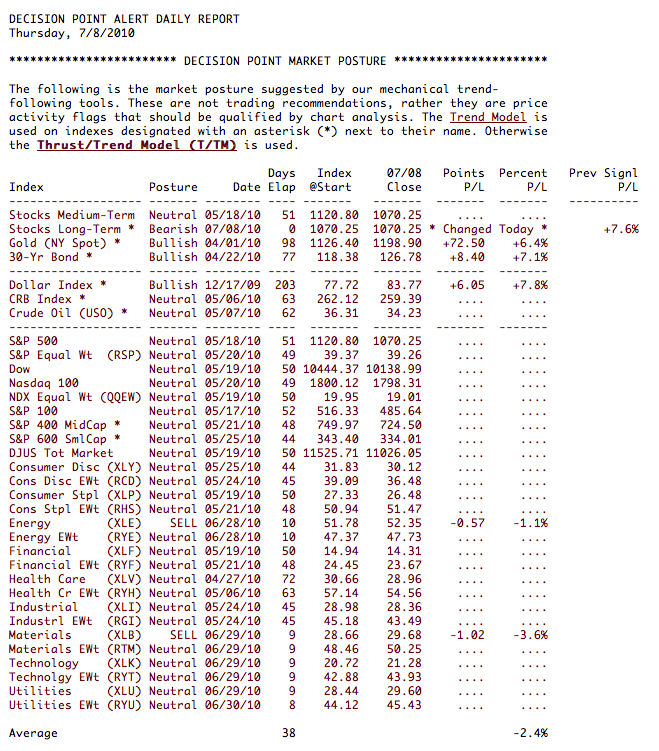
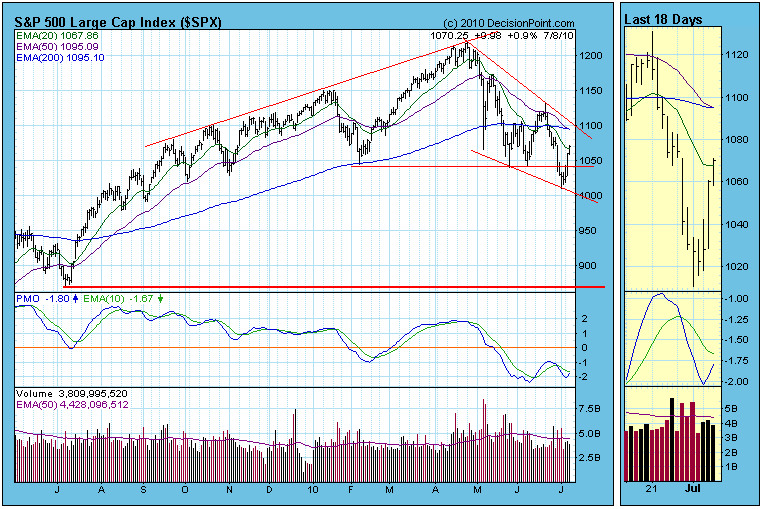
As you can see in our Decision Point Alert Daily Report below our Trend Model has triggered a Long-Term SELL signal for stocks. This occurs when the 50-EMA crosses below the 200-EMA. It has been headed this direction for quite some time so it is not unexpected. Note on the chart below that the margin on this signal was a 50/200-EMA difference of 0.01. Not much, but as long as price remains below those EMAs, the distance between them will continue to increase.

In the daily chart of the SPX we see prices moving up toward resistance in the descending wedge. With our short term indicators still bullish, this could continue.

Our indicators are now looking somewhat schizophrenic with the PMO turning up and moving toward a positive crossover along with other indicators looking bullish in the midst of a new long term SELL signal. This new long term signal gives us a read on the environment in which our shorter term indicators and signals now operate. It tempers our conclusions. Carl's Learning Center article "Bull or Bear Market Rules" explains this best.
As we discussed Wednesday, our bullish short term indicators tell us a move toward resistance could continue. But our environment is now bearish and with the bullish descending wedge being the dominant medium-term pattern, and, ultimately, lower prices should follow even as we move up inside this wedge.
