ChartWatchers May 29, 2009 at 07:28 PM
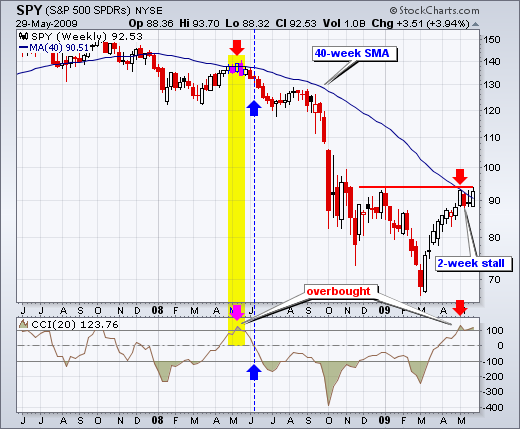
With a huge rally from early March to late May, the S&P 500 ETF (SPY) is trading just above its 40-week moving average and a key momentum oscillator is overbought. The 40-week moving average is the weekly equivalent to the 200-day moving average (40 weeks x 5 days = 200 days)... Read More
ChartWatchers May 17, 2009 at 10:02 AM
BIGGER PIPES, BETTER SERVICE - On Friday, we upgraded our Internet connection from a 180 Megabit connection to a 1 Gigabit Fiber connection (1 Gigabit is 1024 Megabits)... Read More
ChartWatchers May 17, 2009 at 03:37 AM
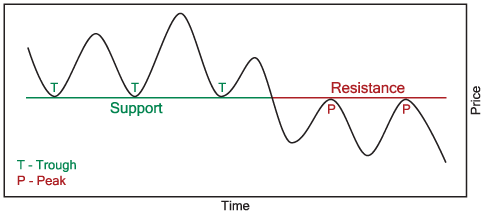
This is the seventh part of a series of articles about Technical Analysis from a new course we're developing. If you are new to charting, these articles will give you the "big picture" behind the charts on our site... Read More
ChartWatchers May 16, 2009 at 07:59 PM
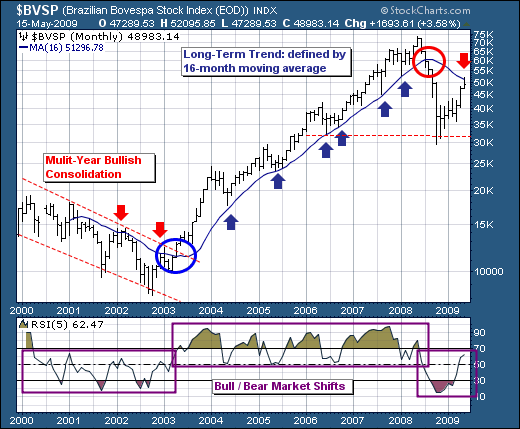
As the markets have rallied off the March 9th bottom, we find it rather interesting that the Emerging Markets have taken a lead role and have outperformed rather handily... Read More
ChartWatchers May 16, 2009 at 07:56 PM
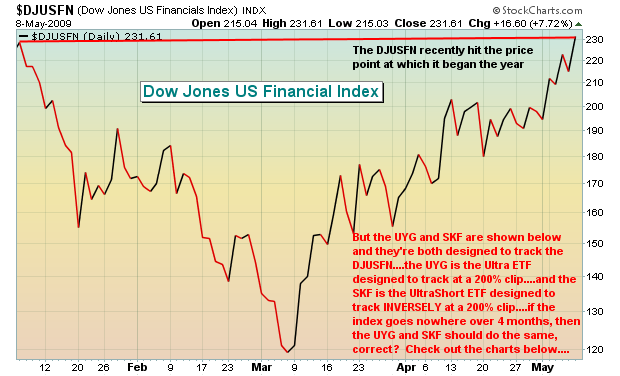
In February, I wrote an article discussing the fact that juiced ETFs (ETFs designed to double or inversely double the returns of an underlying index) do not perform as you might expect. There was a huge response to this article and mostly positive feedback... Read More
ChartWatchers May 16, 2009 at 07:51 PM

I started the week on Monday with the headline that "Upside price and time targets had been hit" and added that overbought readings suggested that the market was vulnerable to profit-taking... Read More
ChartWatchers May 16, 2009 at 12:10 PM
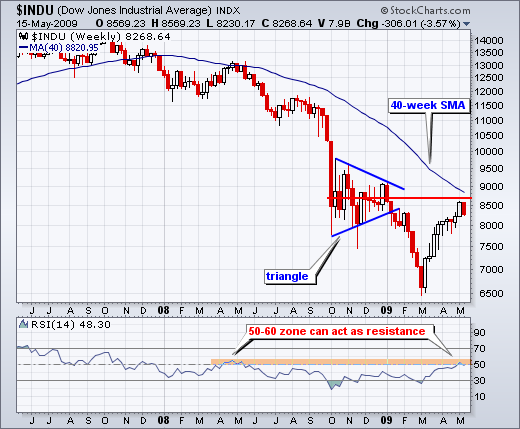
After a massive 9 week advance, the Dow ran into resistance with its biggest weekly decline since early March. There is a resistance zone coming into play around 8700-8800 from the falling 40-week moving average and the Oct-Nov consolidation... Read More
ChartWatchers May 15, 2009 at 09:45 PM
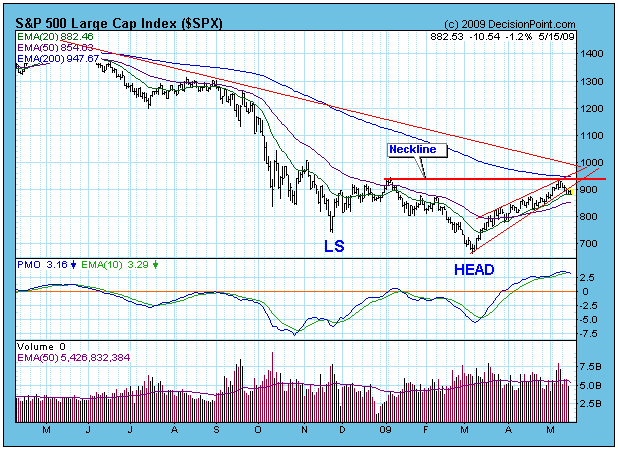
The ascending wedge pattern we discussed last week has broken down as we expected. Considering that the market has rallied nearly 40%, I think it is reasonable to expect more corrective action... Read More
ChartWatchers May 03, 2009 at 01:51 AM
NEW HOME PAGE DEBUTS - Our slick new home page provides you with a quick way to see all of the latest happenings at StockCharts... Read More
ChartWatchers May 03, 2009 at 01:16 AM

This is the sixth part of a series of articles about Technical Analysis from a new course we're developing. If you are new to charting, these articles will give you the "big picture" behind the charts on our site... Read More
ChartWatchers May 02, 2009 at 08:24 PM
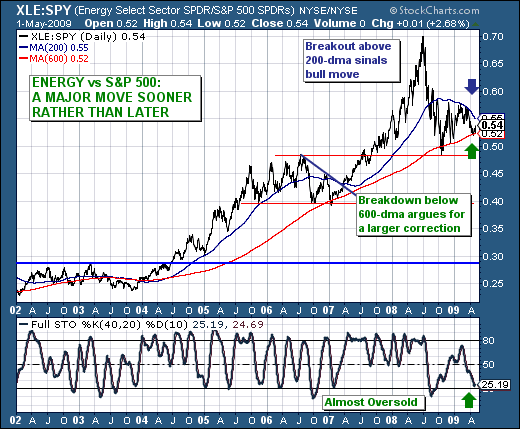
The past several trading sessions have shown an increased propensity for traders to "allocate or rotate" funds into commodity and natural resource stocks. Those gains were no starker than during Friday's trading session, when the S&P Energy Sector (XLE) was higher by +3... Read More
ChartWatchers May 02, 2009 at 06:03 AM
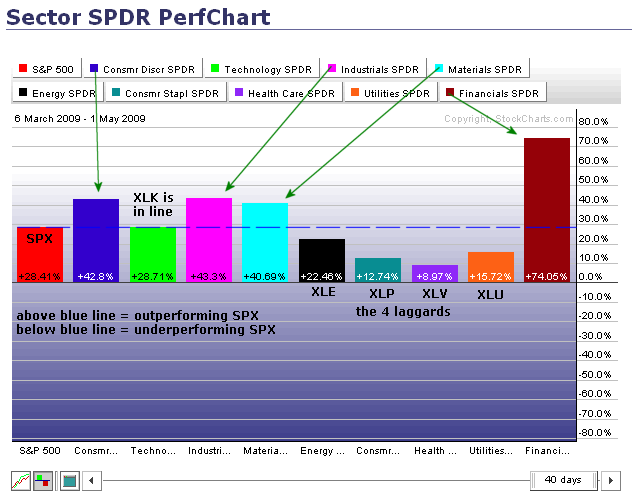
The PerfChart below shows the percentage change for the S&P 500 and the nine sector SPDRs. The S&P 500 acts as the benchmark for relative performance. Sectors with greater percentage gains are outperforming the S&P 500. Sectors smaller percentage gains are underperforming... Read More
ChartWatchers May 01, 2009 at 08:48 PM
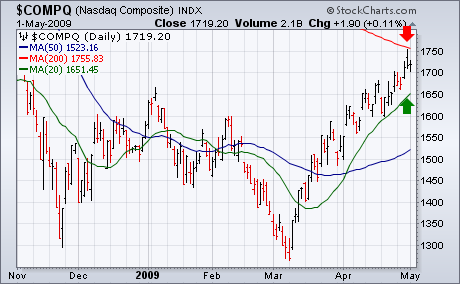
One of the problems with doing an analysis of the "stock market" is choosing which market index to represent it. Like most analysts, I rely on the S&P 500 which is generally viewed as the market benchmark... Read More
ChartWatchers May 01, 2009 at 08:45 PM
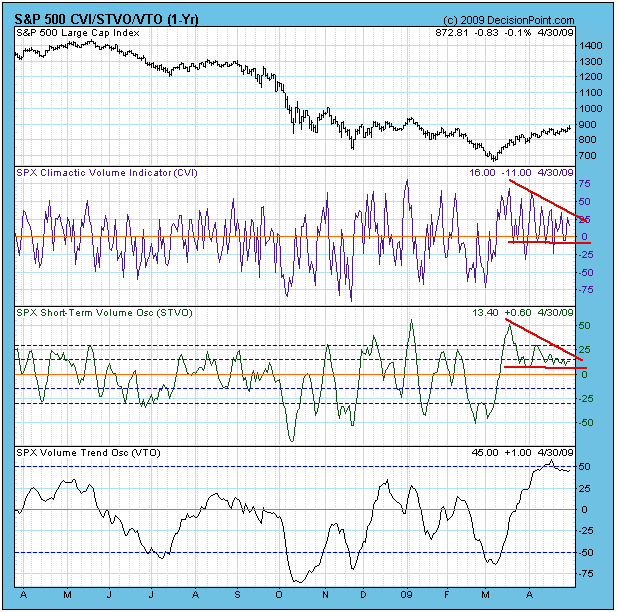
I have been referring to the slow, steady advance of the last few weeks as a "correction". To be more specific, it is a "running correction", which means that prices have moved higher as indicators have chopped sideways and lower... Read More
ChartWatchers April 30, 2009 at 09:00 PM
Ok, I understand the logic - partially. In order of S&P 500 calendar month performance since 1950, May ranks 8th out of 12 and June ranks 10th out of 12... Read More