Timer Digest has ranked Decision Point #1 Bond Timer for the 52-week period ending 1/26/2007. We were also ranked #3 Bond Timer for the year 2006, and #5 Bond Timer for the last five years. Since past performance does not guarantee future results, this information is not particularly useful, except to highlight that we have done something right in the last year or so. Perhaps it would be more accurate to say that the market has favored our methodology, because sometimes it does not. Rather than focusing on the capture of the elusive prize, I thought it would be useful to describe the methodology we are using.
Nearly two years ago I stopped making discretionary calls for bonds (my best guess for market direction), and decided to use a mechanical model that I call the Trend Model, so named because it is driven strictly by trend-following tools, and relies only on the movement of the price index to generate decisions.
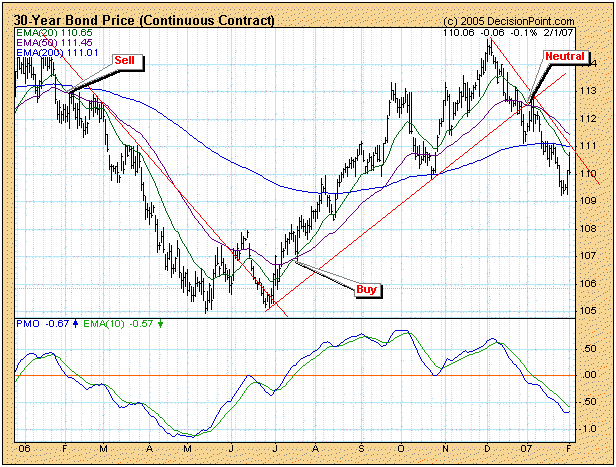
The model uses crossovers of the 20-, 50-, and 200-EMAs (exponential moving averages) of price to generate buy, sell, and neutral signals. The relationship of the 50-EMA to the 200-EMA determines if the price index is in a long-term bull or bear market. For example, it the 50-EMA is above the 200-EMA, it is a bull market.
Crossovers of the 20-EMA and 50-EMA actually generate the signals. If the 20-EMA crosses up through the 50-EMA, a buy signal is generated. When the 20-EMA crosses down through the 50-EMA a sell signal is generated if the 50-EMA is below the 200-EMA, otherwise the model switches to neutral. This is an important feature, because we don't want to be short in a bull market.
The chart below shows important signals generated in the last year. As you can see, the Trend Model is an effective decision-making tool under favorable market conditions.

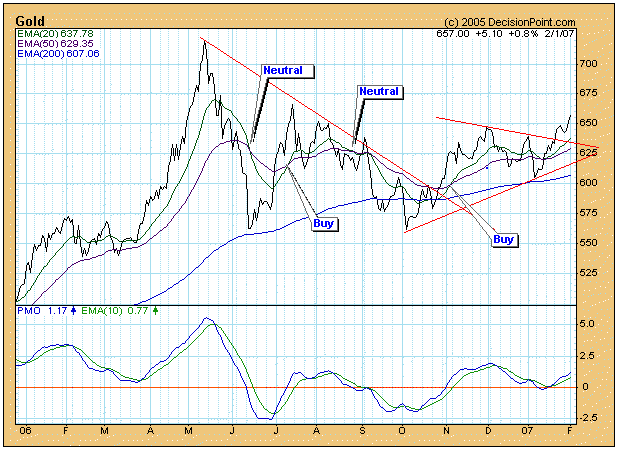
Then there are unfavorable market conditions. On the next chart we can see how the model gets chopped up when a price index decides to move sideways for an extended period of time. On a positive note, it is also clear why the model goes neutral instead of short during a bull market.

Bottom Line: Trend-following models can be very effective when prices move in one direction for extended periods, but whipsaw is always a problem. This is why money management is important. It is also important to apply a timing model across a broad range of price indexes with different price behavior (multiformity), rather than put all your money in a single index/position.
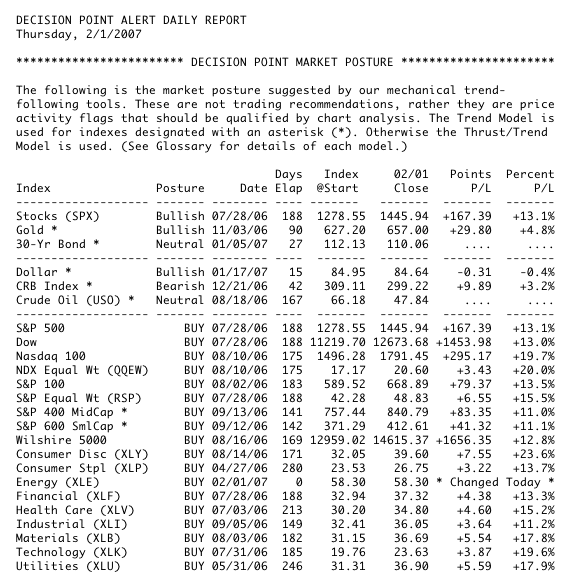
Below is a recent snapshot of our primary timing model status. The indexes marked with an asterisk (*) have signals generated by the Trend Model.

