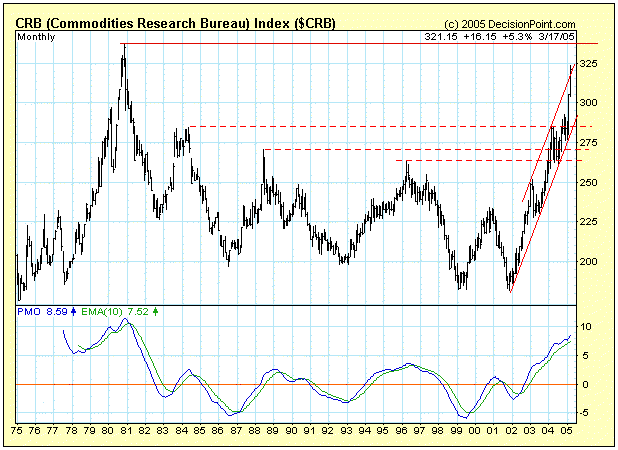
The title of this article, Looking for a CRB Top , has been my broken record for the last year or so, but it just hasn't happened so far.
I use the monthly price chart and PMO ( Price Momentum Oscillator ) to determine when long-term price reversals may be approaching. Last year it looked like a top was forming as the PMO topped twice and prices stalled in the congestion area between about 260 and 285, but this activity proved to be a consolidation that built compression for the most recent rally.
This rally has been virtually straight up. It has broken through the top of the rising trend channel and is close to challenging the 1980 high of 337.60, which is a long-term resistance level. However, evidence of an approaching top is mounting. Sentiment on commodities is very bullish. The PMO is very overbought and approaching the record level of 1980. The recent vertical price advance creates vulnerability for a vertical decline, prior evidence of which you can see on the chart. Finally, the long-term overhead resistance looks like a good place for prices to stall.
While my CRB market posture is bullish based upon a shorter-term trend following model, I think the three-year CRB rally has nearly run its course.

