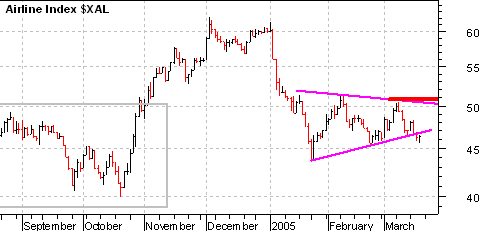
With the surge in oil prices over the last three months, the Amex Airline Index (XAL) remains under pressure. After a sharp decline in January, the index consolidated with a symmetrical triangle. The recent break below the lower trendline is certainly negative and further weakness below the February low (45) would signal a continuation of the January decline. Should the index hold support, look for a move above the early March high to signal that airlines are ready to fly again.
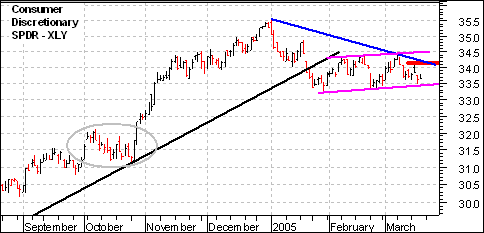
In an interesting and telling twist, the chart for XAL looks similar to the Consumer Discretionary SPDR (XLY) chart. Part of the reason these charts are similar is because their businesses are cyclical and dependent on the economic cycle. Both show sharp January declines followed by consolidations. Because consolidations are continuation patterns, a consolidation after a decline is typically bearish and traders should prepare accordingly.


