ChartWatchers July 24, 2004 at 10:05 PM
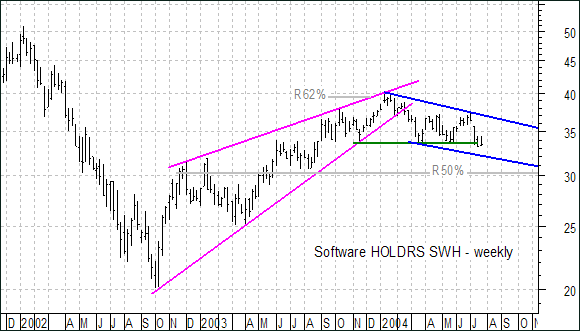
With the peak at 45.78 in January 2004, the Semiconductor HOLDRS (SMH) came relatively close to its high at 50.19. However, the Software HOLDRS (SWH) peaked at 40.20 and fell well short of its 2002 high at 50.91... Read More
ChartWatchers July 24, 2004 at 10:04 PM

I have written on this subject before, but I was inspired by a recent article by Larry McMillan (optionstrategist.com) to visit if again. Recently the NYSE A-D Line hit new all-time highs, and this is being cited as strong evidence that the market is headed higher... Read More
ChartWatchers July 24, 2004 at 10:03 PM
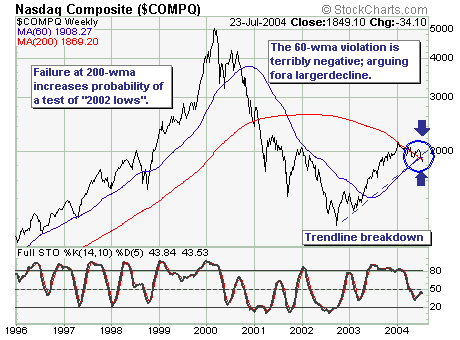
The current technology "malaise" has run for all intents and purposes for the past six months; however, the recent earnings and guidance "misses" have put it on the front burner as expectations for difficult 2H 2004 comparisons have come one quarter early... Read More
ChartWatchers July 24, 2004 at 10:02 PM
GET INVOLVED! - Did you know there was a great place on the Internet to meet other StockCharts.com users and share your knowledge? Join InvestorsHub.com (it's free) and visit to StockCharts.com forum there... Read More
ChartWatchers July 24, 2004 at 10:01 PM

The monthly S&P 500 bars show why it's important to keep an eye on percentage retracement levels -- as well as chart levels. I've shown this chart before, but it's worth showing again... Read More
ChartWatchers July 24, 2004 at 10:00 PM
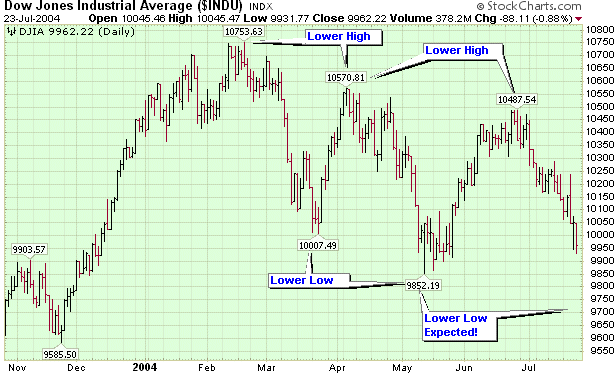
I'm always amazed when the "respectable" financial press gets themselves into a lather about the Dow crossing 10,000. From some of the headlines, you'd think that Friday's close at 9962 was completely unexpected and very significant... Read More
ChartWatchers July 10, 2004 at 10:05 PM

While if is often difficult, if not impossible, to predict the fundamental catalyst, the approaching technical catalyst is clear for the Semiconductor HOLDRS (SMH). Key support and resistance are readily identifiable as well as two important patterns... Read More
ChartWatchers July 10, 2004 at 10:04 PM

The S&P Equal-Weight Index (SPEWI) was developed by Rydex Fund Group in collaboration with Standard & Poor's... Read More
ChartWatchers July 10, 2004 at 10:01 PM
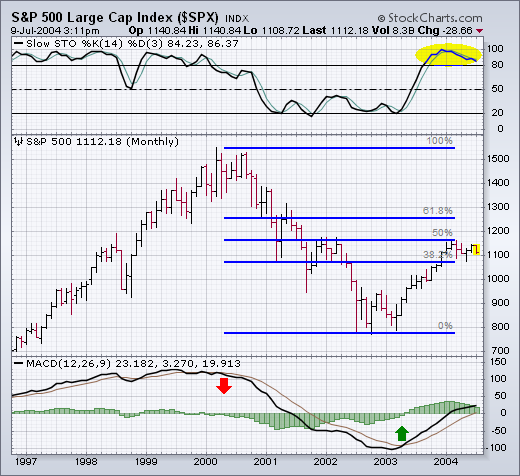
This is a good time to stand back and try to put things into a longer-term perspective. First of all, let's see why the 2004 rally has been stalled. The monthly bars in Chart 1 show that the S&P 500 ran into major chart resistance at its early 2002 peak... Read More
ChartWatchers July 10, 2004 at 10:00 PM
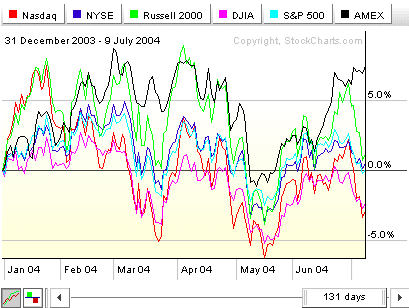
We've passed the halfway mark for 2004 and the markets don't have much to show for it. As you can see in the PerfChart below, the market continues to move sideways in a broad range that's rarely over 5% above or below where it started the year... Read More