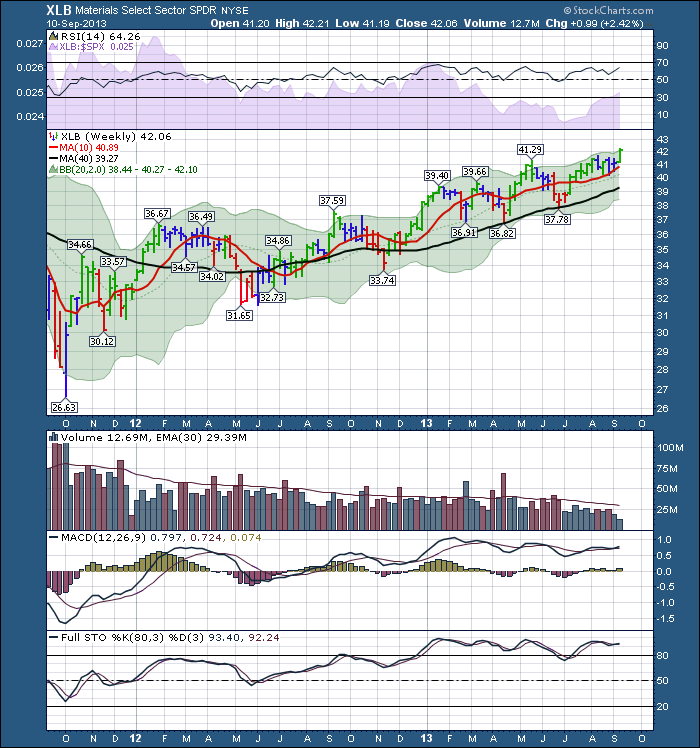
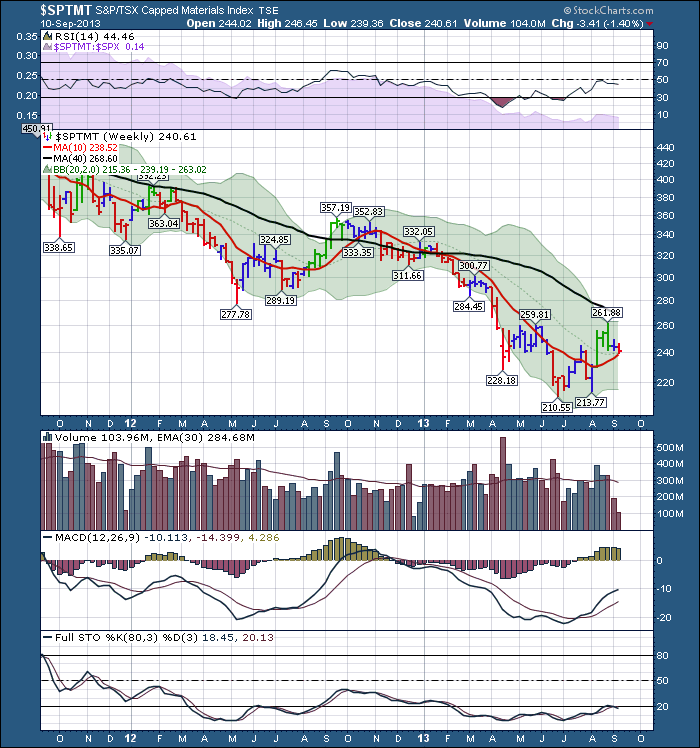
Can you believe the difference in the two indexes? One is bottom left to top right - a.k.a. Bullish.
One is top left to bottom right - a.k.a. bearish.
So nothing looks particularly bullish on the Canadian index as we are setting four week lows.
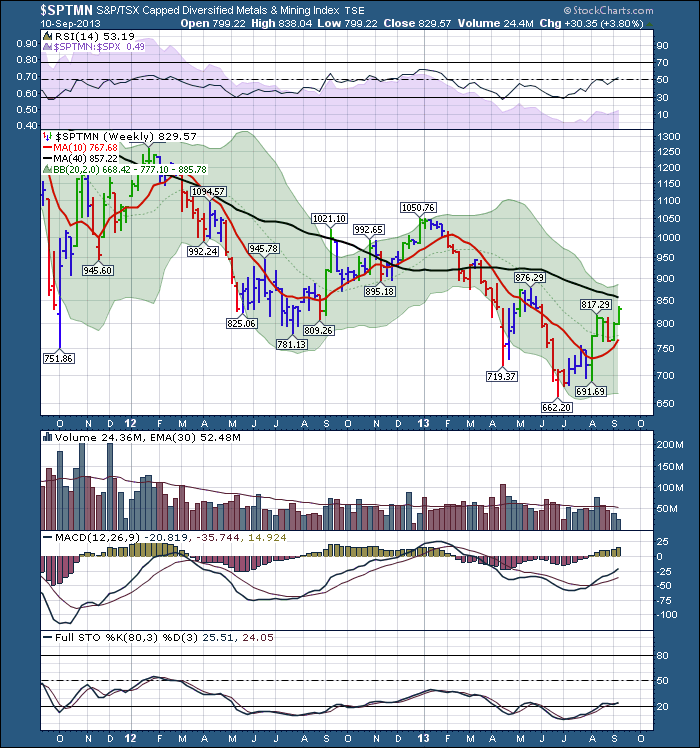
But let's look at the global metals and mining index.
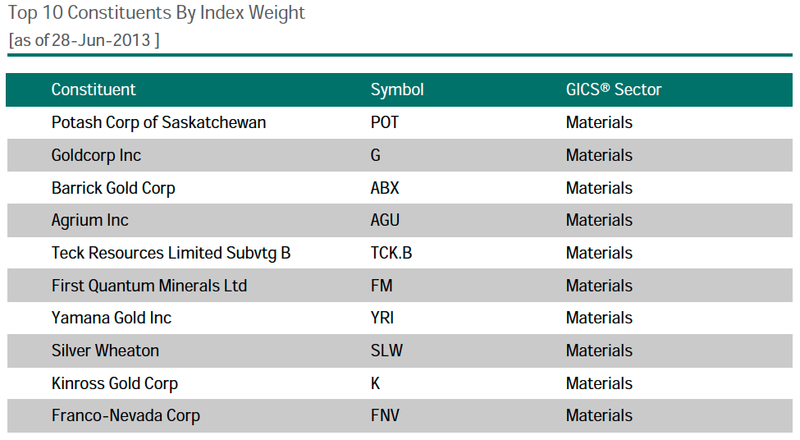
This is the index components list for the Capped Materials index.
The component list for the bottom chart is made up of global mining companies. The list was not available on the website.
The bottom line:
Neither are particularly bullish yet, but the mining companies are jumping out of head/shoulders basing patterns. The Shanghai, $SSEC, broke above the 200 DMA this week. Stocks like HBM.TO and TCK.B/TO are breaking out. The steel sector, the coal sector, general mining sectors are all starting to move.
So not only the US materials sector, but the global sector index is pushing higher. It helps when both China and the India exchange push higher. It is lookin' good so far!
Good trading,
Greg Schnell, CMT


