Back in June, I wrote a series of articles looking at how we might look for a low technically in gold.
Also identified in the article was that trying to find the lows of a stock or commodity are fraught with risk and failure. Finding the right time to enter a trade is important. Knowing when to take profits or stop losses is also important. While the stockcharts blog is not to tell you exact entries and exits of a stock, it is about trying to demonstrate technical tools to find good buy points on a chart.
First of all, to decide how wrong or right a blog writer can be, you can always use the archives. Here is the archive file for The Canadian Technician blog. On the right hand side, is the archives. In June, I wrote at least 6 of my blogs devoted to Gold. Others had gold mentioned in them. I wrote parts 1-5 related to Gold as it was clearly weak and the purpose of the blog was to talk about bottoming in some sector.
If you can't find the articles, its probably because you might not have scrolled to the bottom of 'page one' June blogs and located the 'next' link on the far left under the 'Porridge' blog. On Page 2, you will see the articles.
More important than measuring a persons exact timing of the blog, is to use the tools of the analysis for finding your entry. Maybe you only trade above the 200 DMA. Maybe you only trade below the RSI 30 and look for snap backs. As every reader has different time horizons, technique is probably more helpful than a one time instruction. Hopefully some of my blogs have helped you identify new ways to look at the market. I will have a methodology of looking at charts that is different than another technician.That is why having multiple writers is usually beneficial.
If you get the chance to review the Gold articles, a few of the points we were looking for set up late in the month of June. The article of June 19th talked about the monthly cycle for Gold.
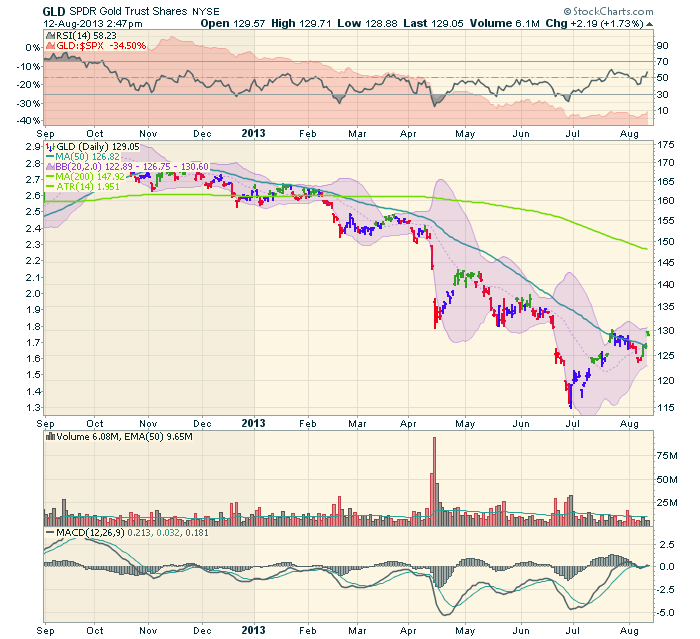
Currently, the precious metals appear to have a rally going on. The depths of the selling were so significant this could end up being a major low. It appears to be a similar setup to the seasonal low in 2012. That induced a rally that lasted till November 1. With the MACD moving back above zero on the daily chart, the Bullish percent index breaking out to the upside and many other technical signals we talked about, this is a nice move to participate in. Trading with a positive MACD is usually a safer entry than deeply oversold. The positive divergence is another positive clue.
The previous paragraph was mostly bullish. Here is the other side. Using GLD to get an intraday view of today, we can see the GLD is right up against the previous support line which usually becomes resistance. That line is clearly at 130 on the chart. Can GLD push above?
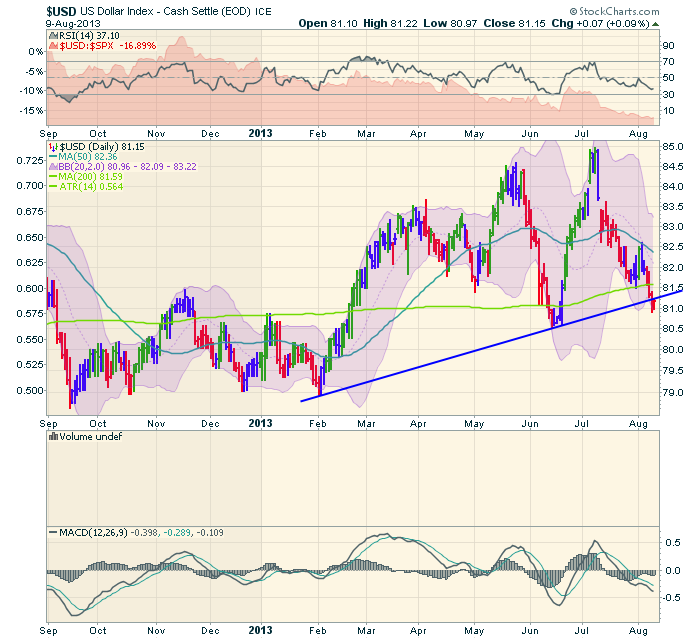
I hope that this review of the bottom fishing in $GOLD has given you some insights on chart setups, intermarket relationships, uses of indicators and how I read them. One chart may make a setup. The good trades usually require more work. Recently the $USD broke below trendline support.
Should this resume its uptrend, $GOLD may find the headwinds reappearing. I like the gold / materials trades here and now. The $USD losing support at its trendline helps me with my directional bias. A change in the $USD from bullish to bearish would be big news. Gold topped within months of the $USD bottoming. If the $USD has topped out and is headed lower, that would be a big trend change and feed into the strength in materials/commodities/ precious metals related issues. Using the intermarket relationships described in the June articles will help us understand why Gold is strengthening or why it may roll over again. Currently the $USD is below the 20,50, 200 DMA's and the trendline. That is bearish $USD, bullish commodities. Should the $USD surge back into an uptrend, I think the move will be important for materials related trades. See the UUP for intraday direction on the $USD.
Good Trading,
Greg Schnell, CMT


