The bearish sentiment in commodities has been a major source of difficulty for the commodity countries of Canada, Australia, Brazil and Russia. No news there.
In major bear markets, the market turns optimistic, has a huge rally only to stall again. We only have a couple of things we can use as defence. As technicians, we use trends. The trend of lower highs and lower lows is important to signal a bear market. The trend of higher highs and higher lows to signal a bull market. The trend of higher highs and lower lows signals indecision as does higher lows and lower highs.
So where are we now? We have sat in a bear market in commodities since the $USD topped in 2011. We have seen the brief rallies come and go, but nothing significant enough to actually turn everyone bullish. With the exception of the Aussie market, we kept making lower highs. Again, so where are we now? Well, let's study the $USD today and the commodities tomorrow.
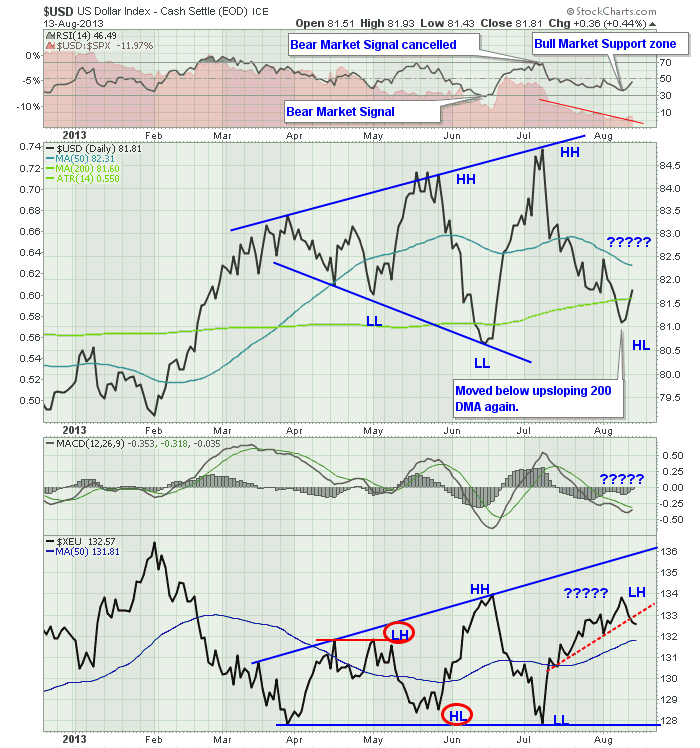
The $USD remains key, so lets look at that chart again.
Starting at the top, the RSI went down to the 30 level in June indicating a new bear market ( short term as this is a daily chart). It quickly recovered and made it back to 70 to cancel the bear market signal. Next, the RSI has retraced to the 40 zone. This is a level where bull markets usually find support. So the RSI currently says higher based on the readings of the last few days but we are testing support.
Behind the RSI, is the SPURS. The shaded area shows whenever the $USD outperforms the SP500 it usually rises sharply. Again, a daily chart so short term view. We are zooming in here. The 'very thin line' in red shows us that the $USD has broken the downterm trend in relative performance. It would appear the $USD is trying to push higher here. Lets not get too far ahead of ourselves. This outperformance is a day or two at most. TIme to stay focused. Lets move to the price plot.
Starting in March, we see a very interesting pattern. After surging to 83, the USD has really oscillated in indecision. It made lower lows (LL) in April, higher highs (HH) in May, lower lows in June, higher highs in July. Today is timely. It currently is making higher lows and the 200 DMA has started to turn up. This is the long trend direction indicator. Up. On a longer daily chart (not shown), this recent low actually tested below the uptrend line from July 2011. Each time the $USD has touched this trendline, it has turned around and moved higher. This most recent test has held so far. It dipped below, causing technicians to go short, only to reverse and go higher again. We are still very close to the line, but at this point we are back above, and the line is holding. If the $USD finds support here, that is a headwind for tomorrows commodities discussion.
To summarize the $USD, we are consolidating sideways, with huge indecision shown by rapid moves and wider ranges every month. Usually this pattern is a 5 wave sequence before it breaks out either way. Getting back above the 50 DMA and breaking above the downward trend around 82 to 82.5 would be on the agenda for next week for the dollar to continue its bullish rise.
Looking at the Euro in the bottom, this is an important indicator for the $USD. It makes up 56% of the dollar index. We can see the difference in structure of the indecision since March. It has been decidedly up. In general, this broadening pattern is bearish. The April lows have held, and the price action has pushed somewhat higher.Some interesting things on the chart. The two red circled areas are where the Euro didn't make newer highs and lows but the $USD did make stronger responses of lower lows and higher highs. So things seem to have returned to alignment with the recent June high in the Euro, low in the $USD. As well the July LL in the Euro coupled with a HH in the dollar suggested they were giving us the same directional clues. What does the Euro say now? Well, it has actually broken its uptrend line shown in dashed red and failed to make a HH. The comparison with the $USD says it has made a HL, so they are in agreement so far. To me, with the Euro breaking its uptrend, failing to make a HH, the $USD turning higher, failing to make a LL suggests the dollar is going to resume its uptrend. But we are only a fews days into a critical juncture.
Searching for a Broadening Top on the Stockcharts.com will give you a beautiful list of articles to look at. You may also see Thomas Bulkowski's work on patterns. Here is a link to an article on the Current Euro pattern of a flat bottom, broadening pattern. Bulkowski. 66% of the time it breaks out downward according to his work.
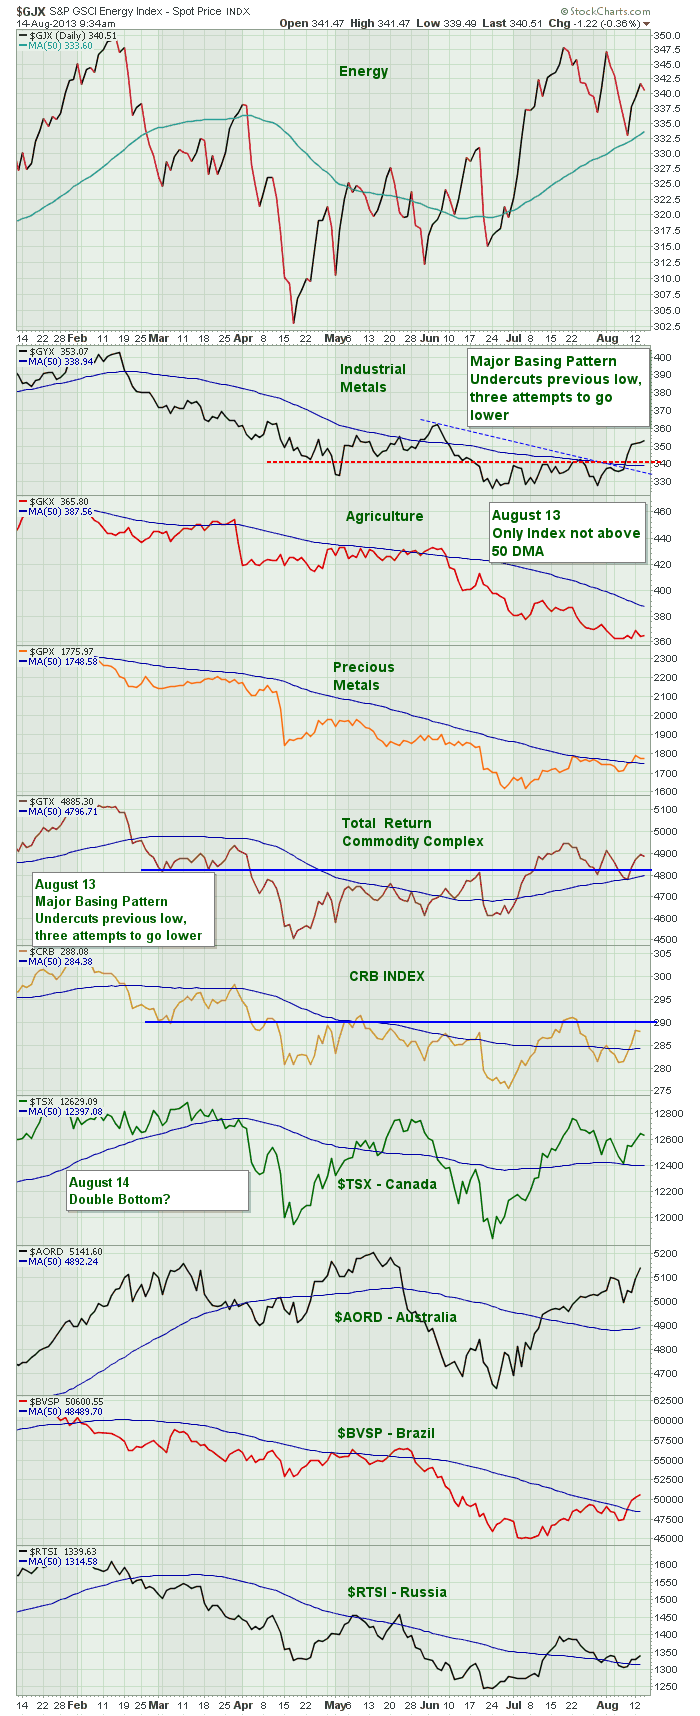
Tomorrow, I'll discuss this commodity dashboard below that looks moderately bullish. But we still have not seen breakouts to new highs in a lot of cases.
Remember to enrol in the SCU classes. Beginners through experts are commonly surprised at how much the site offers. Veterans have continued to use their existing workflows ignoring the vast enhancements while beginners don't know where to start. There are lots of exciting tools hidden on the website like the Golden Line that get thoroughly explained at an SCU class. Here is the link. SCU
Good trading,
Greg Schnell, CMT.


