Happy Independence Day to our American colleagues.
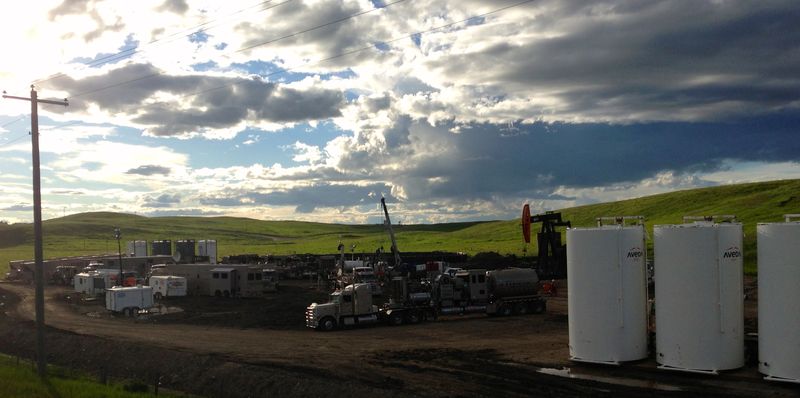
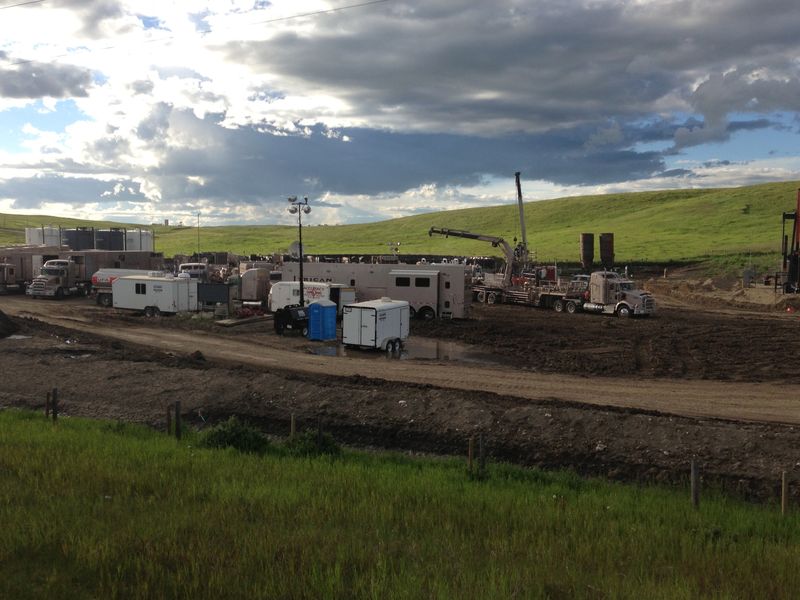
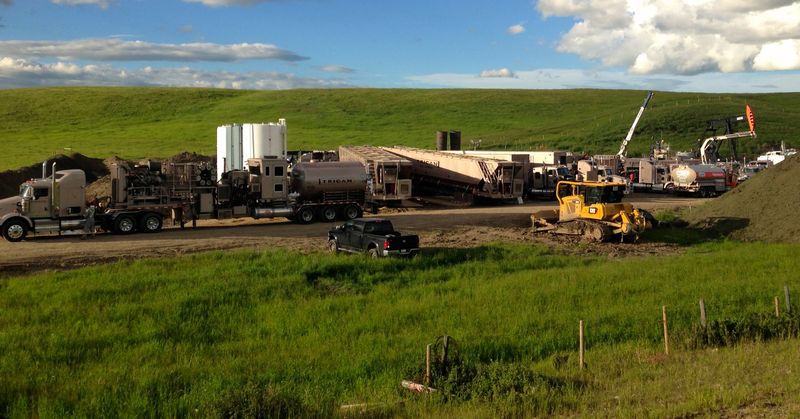
Driving through the Alberta foothills the other night and came across this Trican fracing job(should be spelt without the 'k'). The engines were quiet so we were not at the high pressure moment! You can see it takes a lot of specialized equipment to do a frac.
Extremely heavy equipment, usually muddy leases, and a remote, unique environment make this a very challenging operation.
Trican is one of Canada's oilfield service companies. When you drive around Alberta in the very early morning, you'll see entire frac crews on the road. The likes of Canyon, Calfrac, Cathedral all have to move between the sites, so it is common to see the operations rolling on the highway. These guys were finished and just packing up. The truck in the first picture is just rolling out in the third.
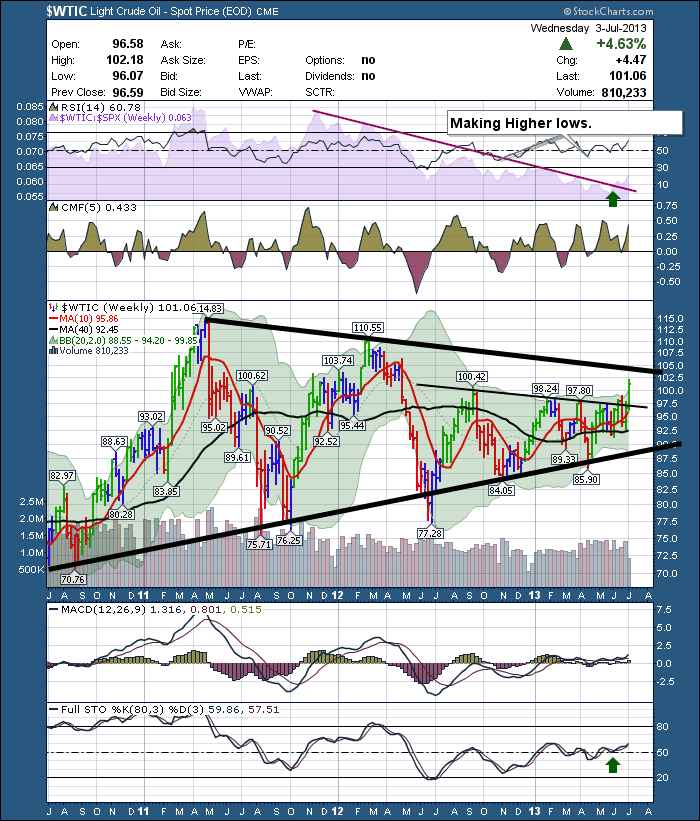
So that brings me to our blog. Oil has moved above $100 but it has tested the $97 -$98 range numerous times in the last year. Two weeks ago, it broke above and then retraced. I was thinking it was a false breakout. This week it bubbled above the trendline just like in Jed Clampetts story.
Here is the chart of $WTIC.
What also makes this interesting is the seasonality work of Brooke Thackray. He writes the Stock Market Almanac for Canada. The first week of July is a seasonally good time to look at the oil companies.
We can see that the push up in oil has made a new 52 week high. Very bullish and at the right time of year. We can see major overhead resistance around $104 to $105. We can see Crude underperforming the $SPX since the latter months of 2011. We don't know if oil can continue to rise. I know the seasonal oil in inventory is well above historical highs, so I am at a loss as to what's holding it up here. Better to trade with new 52 week highs than against them.
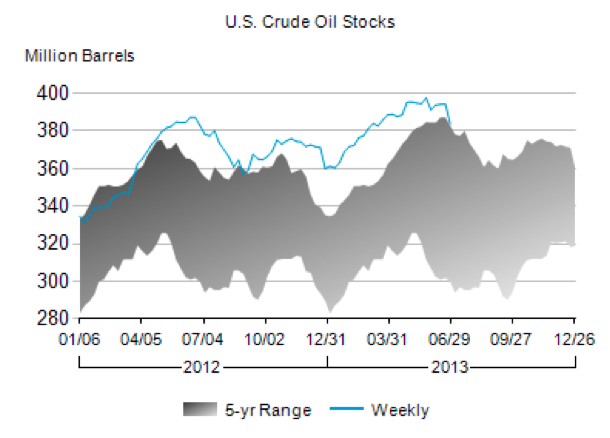
Be cautious as the crude inventory data does not seem to support this. Maybe the Egypt, Turkey, Syria situations continue to slide into more disruptive situations and the North American continent becomes a supplier of crude to other parts till the Suez Canal and the Mediterranean shores get more stability. Here is the Oil Inventory Link.
This was as of June 28th, 2013. You can see we have been tracking well above the 5 year area and the recent peak of almost 400 Million barrels was the highest level in at least the last 5 years. We are entering a period where inventory is drawn down till the end of September. When inventories are declining, that can be bullish for the sector.
Good Trading,
Greg Schnell, CMT

