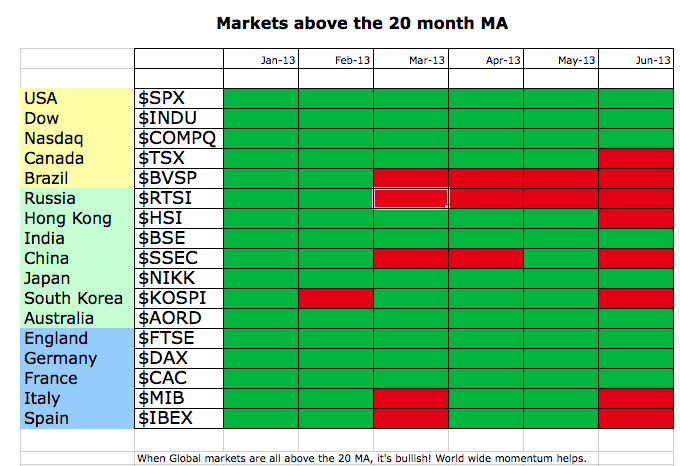
The month of June was a give back month. During the month, most world markets pulled back but settled well off their lows. The two long charts below lay out why I think the global situation could be the major clues to the North American market levels in the fall. To set the stage, here is a list of the major markets I follow. I like to keep track of what is above the 20 month moving average. Why the 20 month? When I went back and looked at the global picture from 2000 - 2013, they all jumped above the 20 month MA together to start a new bull market and stayed above. We had that condition in January of this year. What is odd is that as the USA has rallied, the rest of world has flickered and not been as strong. That is very clear this month, as more charts are below the 20 month MA than at any time this year. I have grouped them in the Americas, Australasia and Europe.
Below is the chart with the Americas and a few of Asia.
The blue horizontals are major support and resistance for the last 15 years.
Brief Comments :
America - Full speed ahead. Gentle pullback this month with the lows taking out the previous month. Caution as you are making a lower low. Watch for a higher high now.
Canada - $TSX - Full bear market mode. Making lower highs and lower lows for the last 4 months. Below the 20 MMA.
Japan - $NIKK - Full 25% range in the last 2 months! The chart says indecision with the price concluding near the previous close 2 months in a row after testing higher and lower.
Australia- $AORD - Lowest close in 6 months. Got down near the 20 MMA very quickly.
China - $SSEC - Made 4 year lows and closed just inside the lower Bollinger Band. Well below the 20 MMA. Dropped below blue line support. Weakest month since 2009.
Hong Kong- $HSI - Lowest close in 9 months - Dropped below blue line support. Failed at downsloping blue line. closed below the 20 MMA.
Russia - $RTSI - Lowest close in a year. Bounced off the lower BB, Sitting well below 20 MMA.
England - $FTSE - Lowest close in 6 months, 10% off the highs, Bounced off the support area. Germany- $DAX - Gave up most of May's gains. Still strong. Bounced off support. Weak black candle by making a lower low than May.
France - $CAC - Another bounce off the 6 month lows. Still did not break above 2011 highs, unlike Germany and England.
Spain - $IBEX - Not really a good month. Closed below 20 MMA, lowest close in 9 months after trending sideways. Now they bounce around in order a bit as I added a few.
South Korea- $KOSPI - Home of Samsung. Making 1 year lows, Broke upward trendline and now confirmed down. Below 20 MMA.
India - $BSE - Very important market. Still bullish. Sideways range for the last 6 months. Stuck below 2008 and 2010 highs.
Brazil - $BVSP - The weakest chart of the month of all. Snapped its trendline months ago, closed below the 20 MMA and the lower BB. Made 4 year lows.
Italy - $MIB Closed at the low end of 10 month range. Closed below the 20 MMA. Pinching BB.
Quick summary.
The commodity countries : Canada, Brazil and Russia are very weak. Australia is making lower lows but still above 20 MMA.
Europe: Spain and Italy are back below the 20 Month.France could not break out yet. England and Germany had large pullbacks.
Australasia : Extremely weak. Only Australia,India and Japan remain above the 20 MMA. I'm watching $SSEC for clues.
America - By far the strongest market in the world is the USA. But the neighbours are not as strong as USA which is odd as strong trade alliances would usually help the neighbours.
Good Trading,
Greg Schnell, CMT


