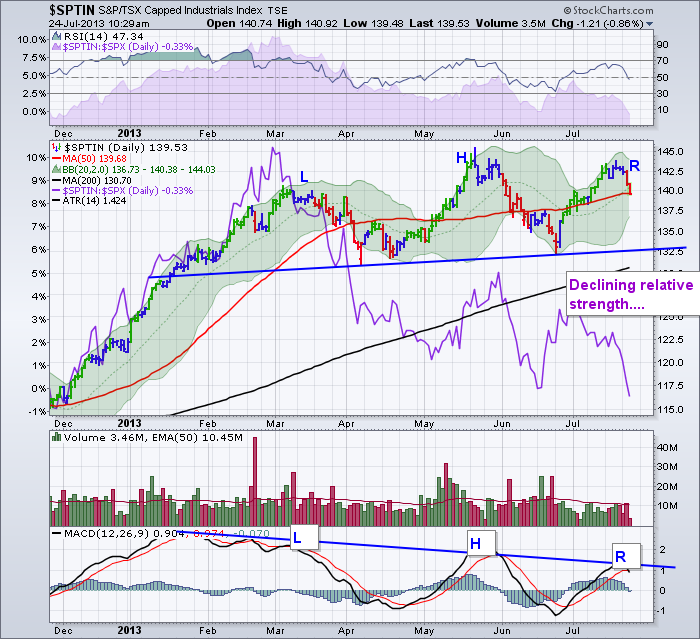
The S&P index for the Canadian Industrials is $SPTIN.There are a few concerning things on the chart that investors should be aware of.
The RSI is making lower highs. The Relative strength (SPURS) is weakening on each peak. This is shown in purple in the area chart or behind price. Making higher highs, while the relative strength drops is concerning. I'll show the Telecom Services example so one can see why further down.
As well, we have a Head/Shoulders top building with a weaker MACD on every rise. This is very concerning. The volume on the May high plummeted and we can see the recent volume was also low. This has two problems. One is seasonality where the markets are quieter anyway so the data is harder to read. The second is the surges are very powerful. When they roll over, they have been equally quick. There is a small volume clue in that there was no volume pick up on the latest run up. Again, hard to read/rely on because of the weak volume seasonality.
The MACD rolling over just above zero is not good.
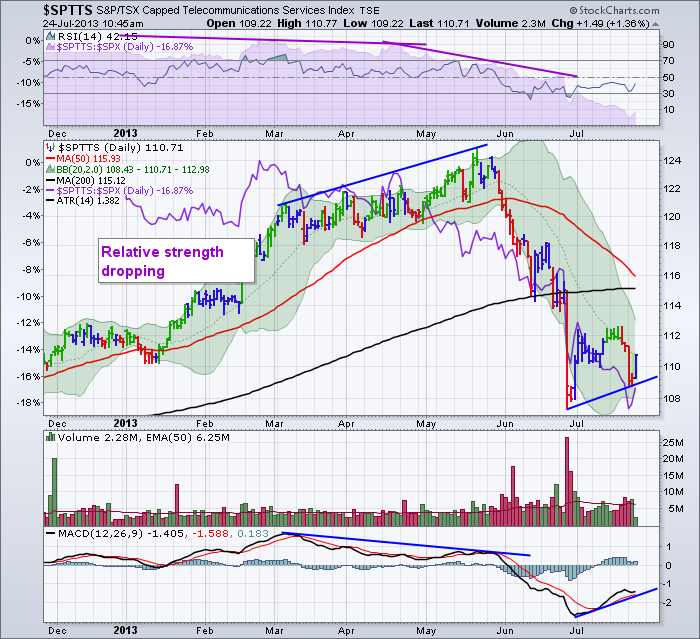
Here is the Telecom Services example.You can see the relative strength falling hard as the index made new highs. The divergence in price (going higher) with the MACD making a much lower high marked by the blue lines is important. Couple that with a drop in relative strength as shown in purple (SPURS), and that is not good.
There was no volume clue that I can see on this chart. Nor did the index take the time to carve a simple head/shoulders top. Currently it is bouncing up. We'll see if it gets stalled at the 115 level where the 50 and 200 DMA's are currently positioned.
Good trading,
Greg Schnell, CMT


