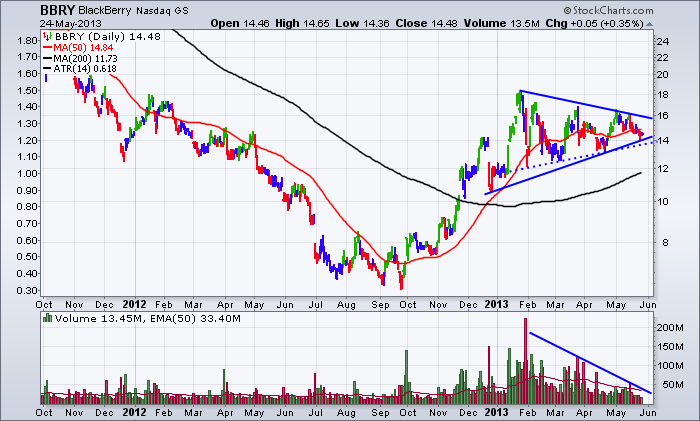
Here is the recent view of BBRY.
This chart will probably gap either way, but the earnings announcement will be on June 28th. It may gap before the earnings.
I would suggest that price action in the low 12's will be a signal that this company goes the way of former greats in the cell phone industry, whereas a break above 17 bodes well.
The pattern suggests indecision on the direction of Blackberry and the dotted line is a more symmetrical pennant but the last touch of the blue solid line made me draw the solid line there. By next week, we may find the blue dotted line gets touched and we bounce off that.
Normally, a pennant is considered a consolidation and continuation pattern, but they can be reversal patterns as well.
The upturn of the 200 DMA and the horizontal action of the 50 DMA is still positive for the stock.
It is interesting how $14 was the first pause of the initial upthrust in late December, and now takes on such an important level on the stock as the pattern reaches towards the apex. It was also the area of the last high in late April 2012 before plummeting.
Looking left on the chart shows an area from Dec 2011 to May of 2012 a little below $13 ($12.46 to 12.80) that was support until the stock collapsed and lost 50% from there in just a few months.
Notice the current volume decline. Very compressed. I removed the MACD and RSI as I did not find the tools demonstrating anything important. At this point, price action looks to be the strongest clue.
Good Trading,
Greg Schnell, CMT

