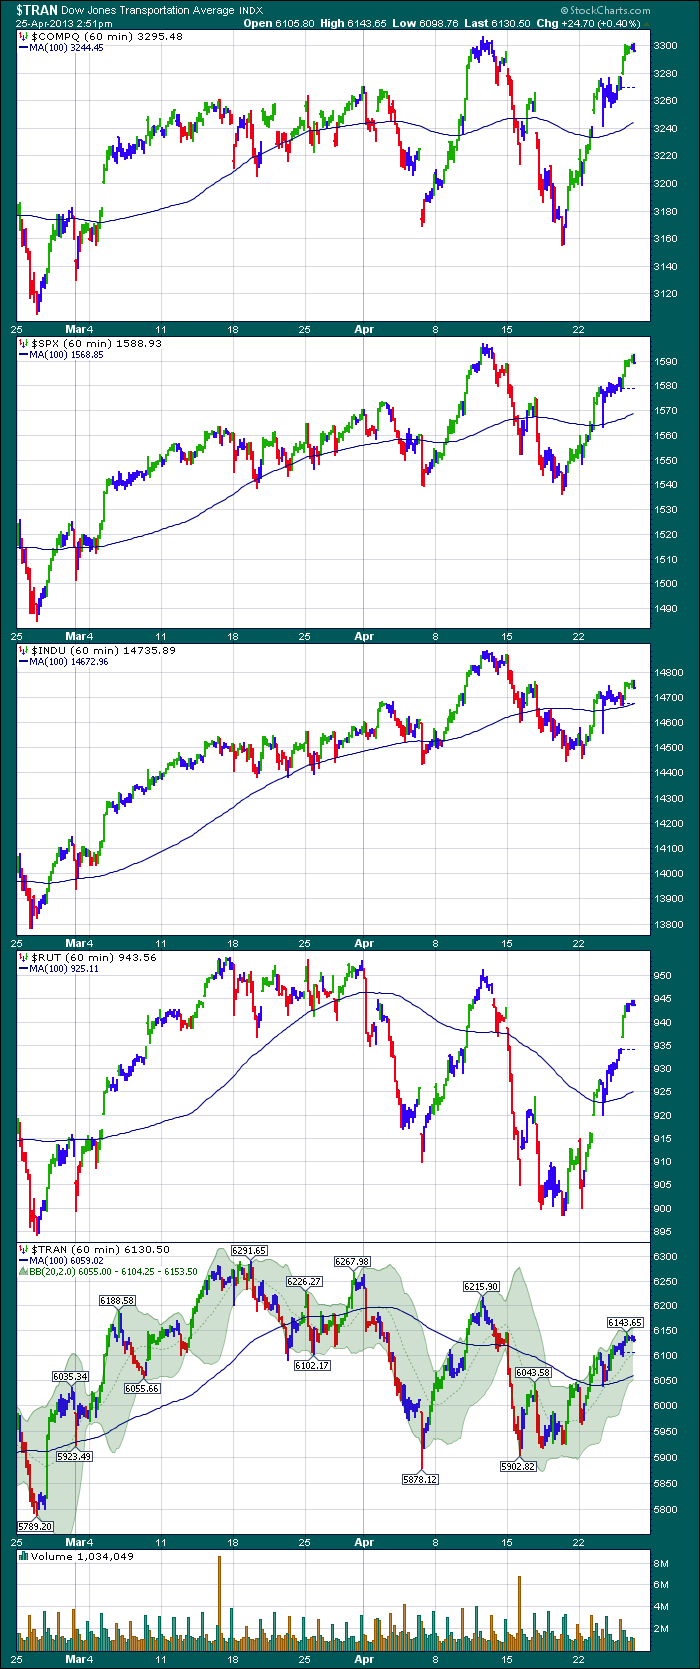
Sometimes, the market can mask internal weakness and all of a sudden it lets go. Today, the charts are are at an interesting location relative to themselves and the others.
First of all, here is the chart.
So I have placed the indexes in order of strongest to weakest based on the 60 minute chart.
So the chart is $TRAN but everything else was stronger so $TRAN ended up on the bottom.
The $COMPQ is trying to take out old highs and has been here for about 6 hours now.
The $SPX is a little weaker. It is testing the support level right under the highs of the market back on April 11.
The $INDU is weaker still and is just trying to stay above the last two rally attempts. Not really as close to the previous high. Roughly 100 points away.
The $RUT is starting to make wider and wider swings with lower highs and lower lows. That trend is being tested right now.
Lastly, the $TRAN has lower highs and lower lows like the $RUT. The last low took longer to base and was slightly higher than the previous low.
What does this mean? Well, the trend is weakening as these start to wobble. Obviously some sectors are stronger than others. If the rotation can occur to move into the industrial and material sectors, we have a good shot at going higher. Stocks like Ford and Magna are trying to break out from recent resistance. We are at an interesting inflection point. We'll see where we go from here.
Good Trading,
Greg Schnell, CMT.

