I had the pleasure of spending Saturday with Martin Pring working through chart decks. It was the equivalent of musicians gettting together and jamming. Except we used charts. Sitting in Martin's office just working through different thoughts and concepts while enjoying a cup of tea was just great!
Martin's main body of work is the long cycle information from his KST. This can be found in chart indicators. We just had so many charts to discuss, but we both agreed this was one of the more defining times in the market.
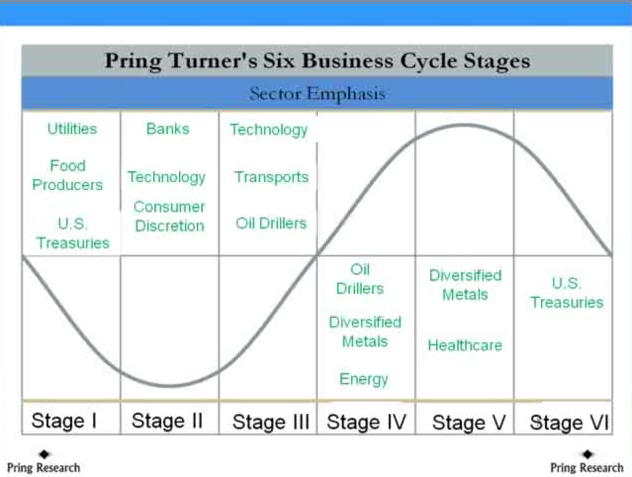
While Martin's work on the long cycle indicated the start of stage 4 awhile ago, the charts I presented included the $BVSP, $RTSI,$AORD and $TSX to demonstrate how they are all at significant resistance whereas US commodity stocks look better.
So Martin likes the energy and metals sectors in this stage. That should be a strong bull case for the four main commodity indexes.
Lets look at them.
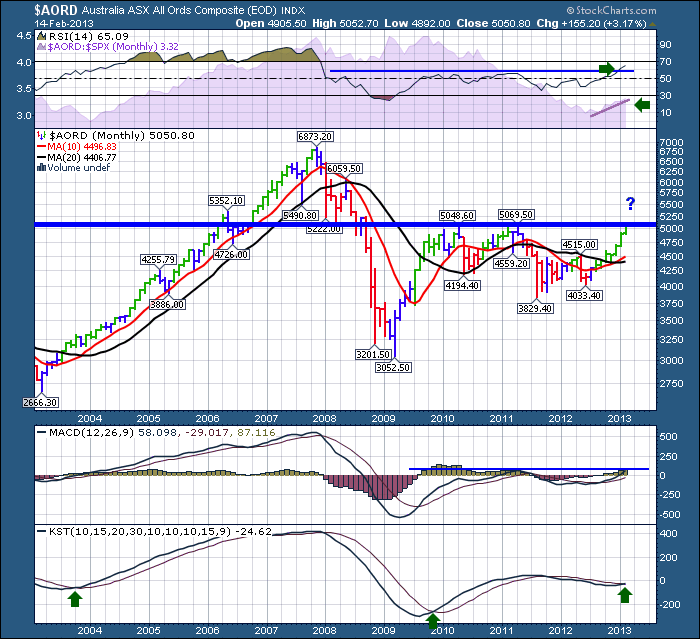
Here is Australia.
By far, this is my favorite chart amongst the 4. Everything is turning up. I like this. The real question now is how does it perform at resistance? This resistance line is also the neckline for a H/S basing pattern where 4194, 3829 and 4033 make the left, head and right pattern. We would like to see the stroke up between the head and right shoulder make it up to the neckline, but it did not. It stalled at 4515.
You can see Martins long term cycle work with the KST just short of crossing. (the number in the KST legend says -24.62). So we are very close!
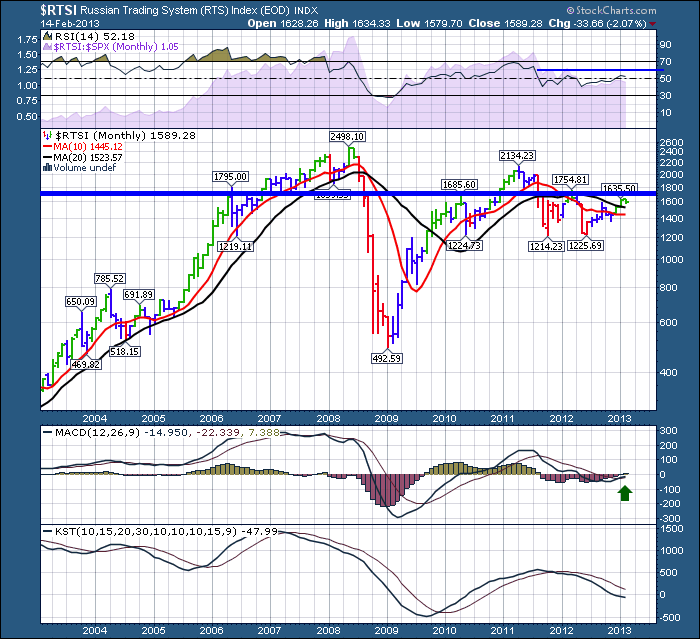
Here is Russia.
This chart is not as robust. The RSI isn't showing any real breaakout power here. The price sits at resistance. The MACD has crossed up but remains below the zero line. Hopefully it can continue to climb but that will depend on resistance. So it is behaving differently.
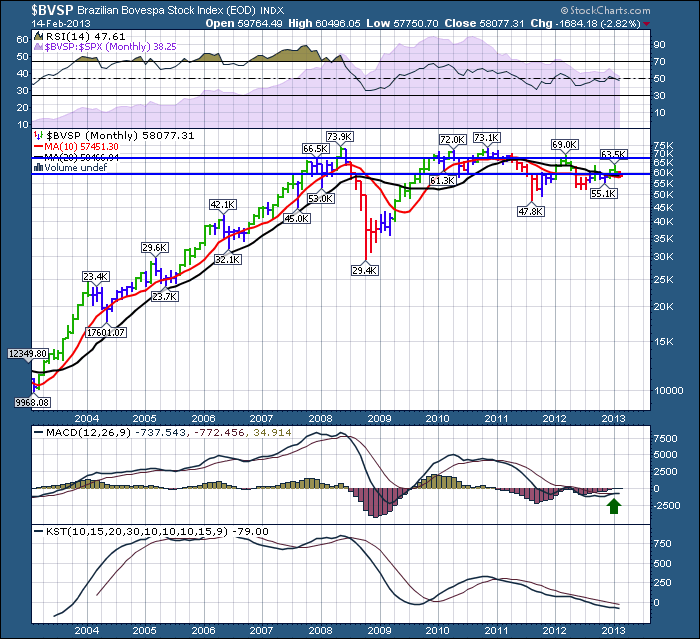
Below is Brazil. Currently it is already on a red elder candle on the monthly charts. The RSI has flatlined, the SPURS line is declining, the MACD is below zero but it has turned up. The KST has not turned up yet. The price action of the index itself is stuck around this lower support /resistance area and has not made it back to the 2012 peak levels yet.
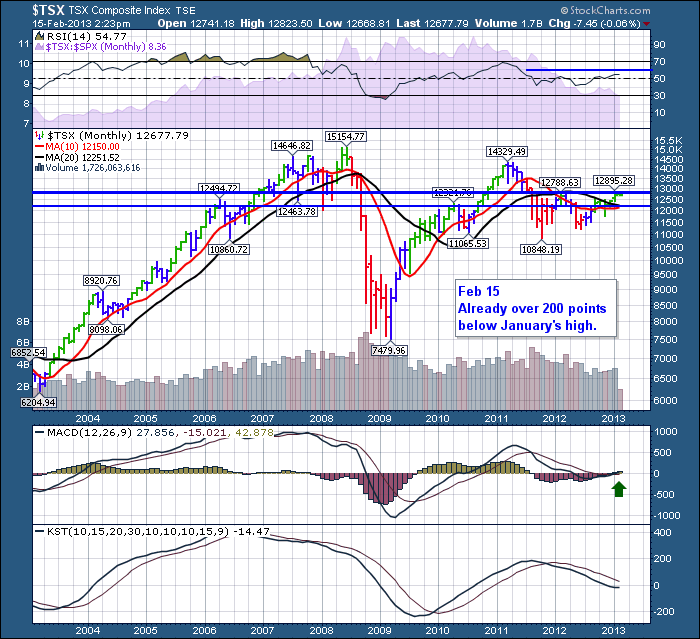
All that brings us back to America's closest neighbour. We get invited to the inauguration parties, the fourth of July parties, the thanksgiving parties, but not to the stock market parties. It really is not so fun!
So this frustrates me. The US side is on another full run to new highs and we are stuck at resistance for 5 going on 6 weeks now. We were able to climb above the previous resistance at 12500 and climbed up to 12895. Now we have already dialed back over 200 points from this level. At least we are still on a green elder candle.
The RSI isn't going anywhere fast but the MACD has climbed above zero which is bullish as long as it does not stall here. The KST looks like it still needs some time.
I expect with the negative divergence on the Japan chart ($NIKK - Not Shown) that that sudden surge is close to done. It is also at resistance. The $DAX and $CAC are both trading below last months range and one of the strongest markets like $BSE (India) has also rolled over. The $HSI is stuck under a downsloping resistance line as well.
On a positive note, the $FTSE is shooting to new highs. Shanghai is doing great. America is doing great.
Only the Brazil market has dropped back below its 20 Month MA so that is good from a macro view.
What do I need to see to get very bullish? I need to see these commodities take their proper role and confirm. As you can see, Martin and I had an interesting discussion on this. The USA is living large and banging out new highs every week. The commodity countries are all at resistance. This feels like 2011 when the Canadian and rest of world markets topped out while America had a 2 year party without inviting the rest of us.
The commodities in general seem to be topping or downright rolling over based on $GOLD. The industrial metals, including copper seem to be weakening (sideways) not rising with the US market. Ag and livestock rolled over a bit, while lumber pulled back and surged to new highs. $WTIC Oil can't break through $100. All the oil majors are not confirming the new highs in the $SPX. By that I mean XOM, RDS/A, BP, TOT, COP. One chart looking different is CVX. It looks better. It looks like the crude oil chart.
This isn't a slam dunk either way. My bullish bias has turned to cautious. Again !!!.Hopefully it all works out and we can push higher. I'm not alone in my thesis.. The argument showing the retail investor piling in now seems to be telling us to get more cautious, not carefree! Maybe stay bullish US and ignore the rest of world? Let's let it play out with a complete understanding of how pivotal the charts are here.
If the commodities don't get going, its another top going into a downturn as the USD goes higher. That's my read. From our discussion, Martin agreed to the importance of this analysis at this point in the business cycle model. We both agreed the overall market feels toppy, not continuing after working through a couple hundred charts! Some of that will be from our review of the technology stocks. I'll blog about that soon.
Good trading,
Greg Schnell, CMT.

