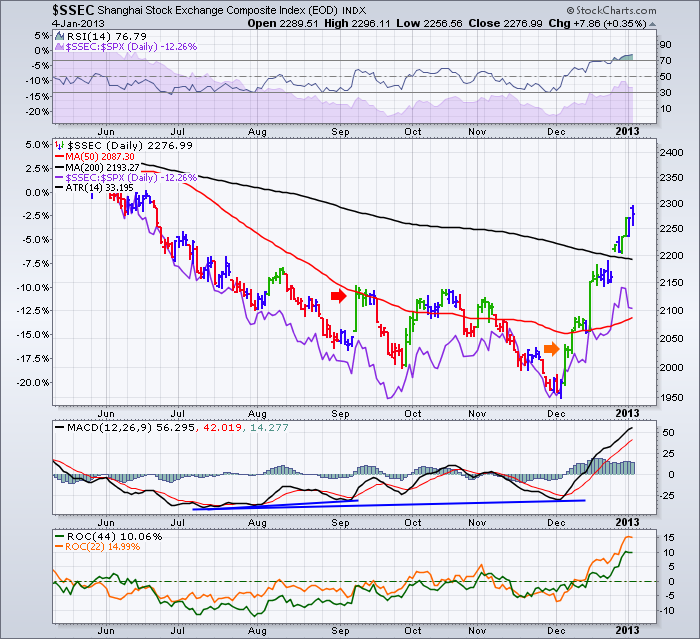
Globally, the one market that just could not get a bounce in most of 2012 was the $SSEC or the Shanghai market. It built a not so beautiful top left to bottom right chart pattern.
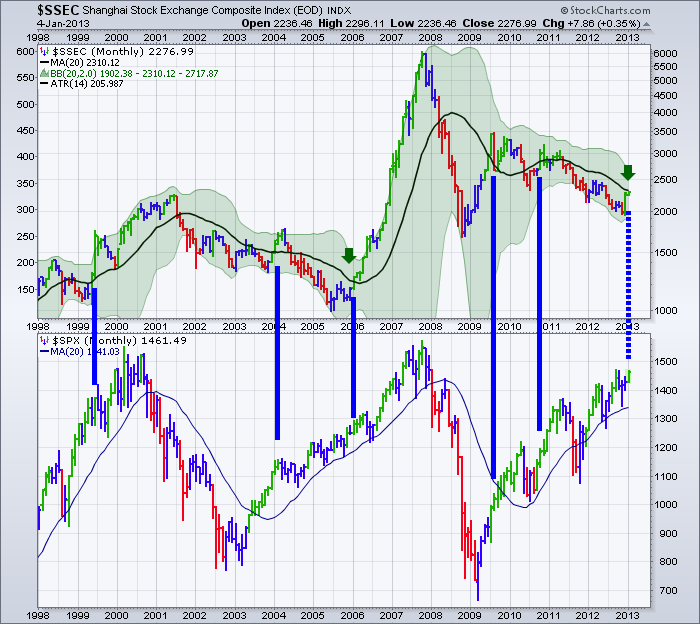
Well, the new look is here. It has a smile from top left to bottom middle to top right.
That's a little less gloomy. This chart gets updated later today. It will print a level of 2286. That is only 25 points or 1% below the 20 Month MA which is at 2310.
Will the spike continue? Probably not in a straight vertical line. Since the settlement of the Chinese leadership for the next 10 years is behind us (November 2012), the market has enjoyed new stability. Some oscillation is normal, so perhaps this level will be the area where a pause comes on the daily. Lets look at the weekly now.
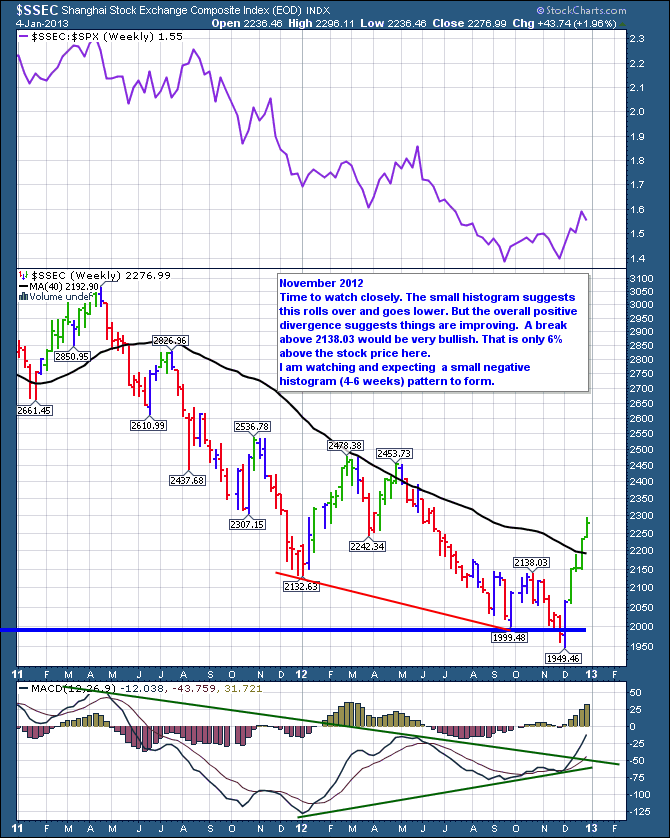
You may remember this chart below. Here are some notes I wrote on the weekly in November 2012.
As you can see, the baby histogram was a real small negative histogram. It dipped down for one week. I think Tom Demark found the low within a day or two and announced it on Bloomberg.So far it has been a 15% reversal! Nice! Looking left on the chart, There appears to be a window of extreme price fluctuation between 2536 and 2132. We probably won't soar through that area without some selling showing up. We are currently about 1/2 way through the congestion zone. There was either a top or a bottom on almost every horizontal line. The one that doesn't have one at 2350 might prove to be resistance just to be different.
Here is the monthly chart of the $SSEC.
Notice how this market did not participate in the 2003 - 2005 rally. But when it started to participate above the 20 Month MA shown in black (2006), it really participated!
Well, here we sit with the US market making a similar run in 2011 -2012 without the participation of the Shanghai index. If the Shanghai market can break above this 2310 level (in Black - 20 Month MA) this would be a very positive development. It is only one strong 1% day in the market away from breaking out. When these investors get on board, they really seem to make a run. The final 2005-2007 rally in America was not nearly as strong as it was in Shanghai. The Shanghai composite spurted like a beach ball that was being held under water and let go!
So while the $SPX holds above or below the moving average better on this chart, the Shanghai composite has had more oscillations. However, the 2 big moves in the last 15 years on the $SPX have been when the entire globe is above the 20 Month MA. Currently we are only a few % away from that on the Russian and 1% on the Shanghai. If the US continues to give fiscal unrest through the political process, the global market looks very attractive for investors. Recently most other markets kept surging regardless of the fiscal cliff.
So, to answer the title's question (Is There A Fly In The Shanghai Ointment?) No, I don't see one yet. However, I would not be too surprised if it took a pause from the recent burst between this 2300 to 2350 level.
Make sure to look on the home page of Stockcharts.com to sign up for the SCU classes. They are coming up real SOON! Here's the Link! SCU
Good Trading,
Greg Schnell, CMT


