My blog earlier this morning generated some discussion, so I thought I would top it up.
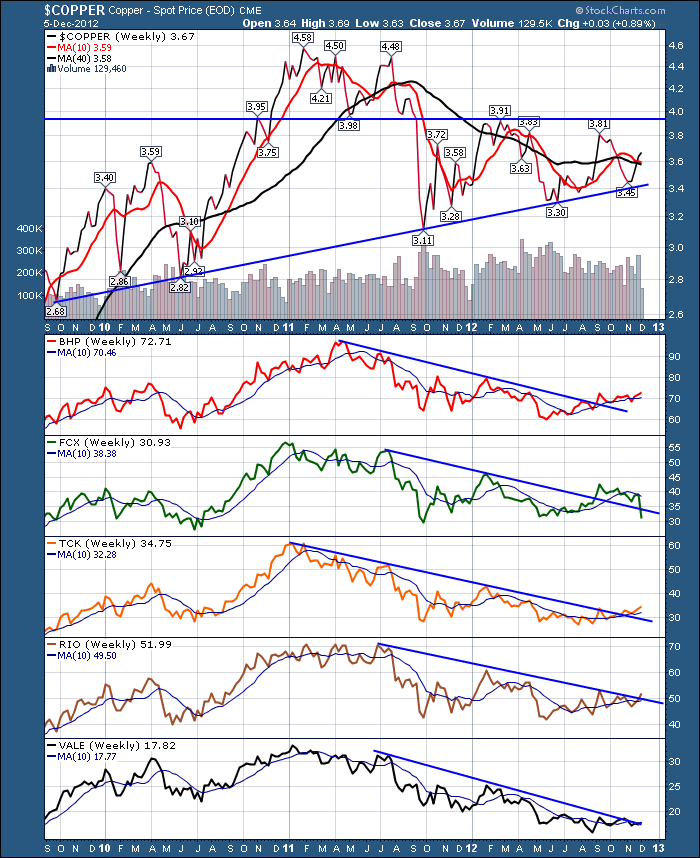
What about that move in FCX? I always like to watch FCX from a copper standpoint. FCX gets more blurred as a copper monitor as $GOLD goes higher. However, $COPPER is the real deal. It is going higher.
The deal announced yesterday to fix a problem in the offshore drilling at Mcmoran (MMR) is interesting. Buying Plains to get more technology is ok, but I see a large supply of oil, and some structural shift to alternatives or Natgas. US oil consumption is still well off its highs of 2007, but production in Canada and the US is significantly higher with the Bakken, Marseilles and Eagleford plays adding investment dollars daily. I do not think the move on FCX yesterday was metals related based on the press release so I am reluctant to take that move as a crunch in the metals. It will obviously affect how institutional price action is shown on the metals complex as they were heavy sellers of FCX yesterday.
My favorite chart for Copper includes the 5 big miners. Copper is surging above the 10 week and 40 week.
1)BHP - sitting near 9 months highs, A h/s bottom forming with highs in April and September making the pattern. A breakout above $73.50 would say off to the races. But a nice series of higher highs and higher lows are in place.
2) FCX could still form a wider h/s bottom with January and September highs marking the pattern. A break through $43ish would do it. Obviously, that is a long ways off from todays $31 test.
3) TCK. Canada's biggest miner and a focus for Canadians. It has been testing breakouts a few times now. It has support and is above the 40 Week. The nice move yesterday was strong and closed at the highest close in 6 months. Full disclosure. I own TCK. I bought it on the H/S pattern right shoulder formation.
4)RIO is breaking this downward trendline now and the series of higher highs and higher lows looks pretty solid.
5)Vale has travelled sideways for 6 months in a major accumulation pattern. A break above $19.18 would confirm this move and I would be very bullish.
Now I could wait for all of these to make more bullish moves, but the mining sector jumped in institutional ownership last week in a big way. Don't know if you use the Investools software. They have a nice summary!
My big macro view is that the world is starting to rally now that the Europeans have said they will do whatever it takes to keep the euro. That means printing money.
So Europe is ok, America is OK now that the election is over, and China has finished their political process for the next 10 years in the last few weeks.
I don't know when Japan has an unravelling. Unbelievable how problems just keep showing up for them. What a gruesome downturn. 39000 to 8000 on their stock market...ouch! But their political process is picking a man who promises inflation so their market has rallied into my bullish signal territory.
IF...and that is a big if, we can get the commodity countries like Canada and Brazil to rally above, we are in a global bull market. Shanghai has a ways to go to confirm it, but I feel like the bottom is in or very near for China. Tom Demark gave his Shanghai weekly and daily charts the all clear on Bloomberg this week. You may wish to google that. Basically the selling is exhausted. Usually a move off selling exhaustion is 50% so a Shanghai at 2900 works for me! I have been watching the Shanghai market every day for months now expecting a basing pattern or final flush. You might have been bored reading about it! Shanghai topped in July of 2009! It has trended down for 1218 days (174 weeks x 7) so well past an extended decline measure by George Lindsays work. If you take the top of the 50% rally in 2010 to current, the decline has been 756 days which fits exactly inside a long decline based on George Lindsays studies.
All that to say, buying the right edge breakouts of basing patterns makes me want to get long. My intermarket work, the miners compared to the metals, the pattern breakouts and the price action of the indexes lead me to believe in this rally. The CNBC frenzy of the fiscal cliff and tying every market tick to it is exhausting to watch. The fear of the fall keeps readers and viewers watching.
I'm watching the charts. Yesterday, as China had a big day, all of the SCTR top up charts and the $TSX big movers and top up charts were shining with metals making up almost 50% of the charts. But more importantly, the moves were breaking out from technical patterns.
If you want more information on watching these market changes, sign up for the SCU classes in 2013. It could make your trading substantially more profitable when you learn how to use the Stockcharts engine to flag new winners. The link is on the homepage. By the way, Stockcharts is getting very aggessive on building out regional education classes. Stay tuned in on the education series for 2013.
Good Trading,
Greg Schnell, CMT


