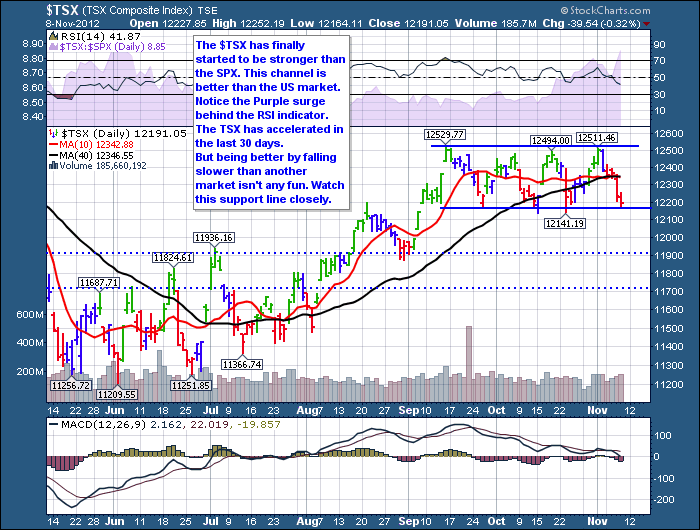
The $TSX has recently started to outperform the $SPX.
THe Purple area is the SPURS. Relative Strength to the $SPX. It is pushing up. However, the $TSX is stuck in this channel. A breakout to the topside would mark a commodities breakout. A break down is very important. I think it goes lower on Energy weakness. But the chart holds the facts. Follow the chart.
Good Trading
Greg Schnell, CMT

About the author:
Greg Schnell, CMT, MFTA is Chief Technical Analyst at Osprey Strategic specializing in intermarket and commodities analysis. He is also the co-author of Stock Charts For Dummies (Wiley, 2018). Based in Calgary, Greg is a board member of the Canadian Society of Technical Analysts (CSTA) and the chairman of the CSTA Calgary chapter. He is an active member of both the CMT Association and the International Federation of Technical Analysts (IFTA).
Learn More
