Textbooks are written about trading. Some don't see enough investors eye balls. This chart has some serious technicals right now.
Let's watch Apple to see a trade progression here over the next few weeks.
OK a few things have happened. Apple has pulled back 50% on some of the previous pullbacks in this uptrend which were scary for investors to behold. Is Apple done pulling back now? I think the big market top in Apple is in, but what about right here and now? What to do?
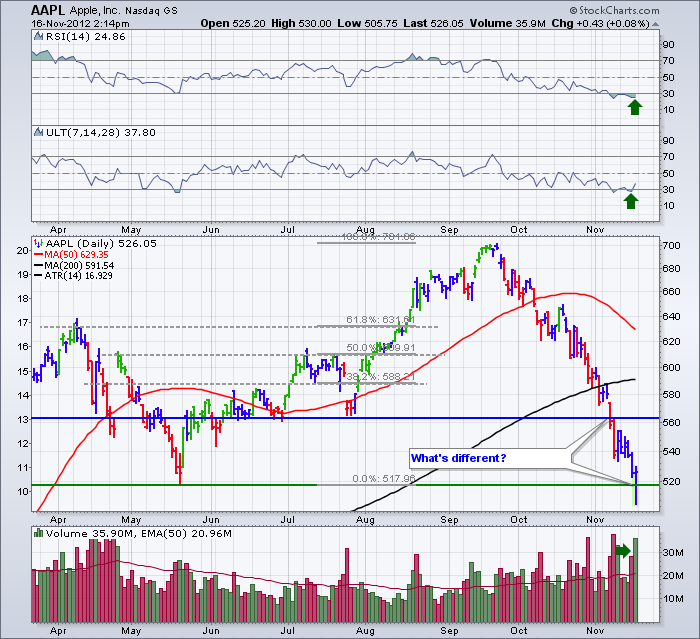
Apple kissed $505.00 this morning on a serious pullback. But here at the middle of the day, the volume is already one of the biggest days ever. What is going on? Well, the stops were being farmed in Apple. The price ran down below the May level just to get all the shares for sale that were only to be sold if the price retraced to there. Well, within a 1/2 day, the price is bouncing back up. When we broke through the previous low level, marked by the blue line, the price still did not rally. It closed on its lows that day. Today, at the green line, the price is behaving significantly differently. Today it will probably close at or near the high of the day, with a bullish Harami candle. It would still be bullish if it closes in the top half of the candle. What makes it really bullish is the farming of the stops that any weak holders who placed stops are now out. Apple should rally from here based on technical work.
Where will Apple rally to? Well here are the technical lines we would like to see hit. The gray fibonacci lines are all interesting targets. One is at the 50 dma and price resistance on the way up. One is at the 200 dma and where price found resistance during the May basing period. The 50% retracement is where Apple also found resistance on the way up and made a h/s bottom neckline. Obviously the moving averages will change as Apple starts to move up here over the next few weeks. The confluence of the 50 DMA, the 200 DMA and these significant levels on the Fib ratios should provide some interesting price behaviour. It wouldn't surprise me that at some point all three are at the same price as Apple arrives there. This is where I would expect the right shoulder to be of Apple's final top. Maybe I'll be wrong and Apple will go on to make new highs. Forecasting the future is wrought with fury for those who venture. Setting targets, stops and entries is a technicians business. Is all I see today is an attractive entry with a nice tight stop just below. We'll watch the future unfold and set targets and stops accordingly.
OK. Just to prepare some more TA thanksgiving spirit. Under the gray 50% line on the left marks a Head and shoulders bottom that goes from $520 at the low to $610 at the neckline. A $90 move. Where did Apple top out at? $90 above the neckline. $700. Another helpful gift from the TA community for those investors. How do you like them Apples eh? Unfortunately, I didn't notice it as Apple rose though.
This is a thoroughly blogged stock, but the technical evidence on the chart is very compelling. It makes for great writing when things line up this well. Let's see how it works out.
Good Trading,
Greg Schnell, CMT

