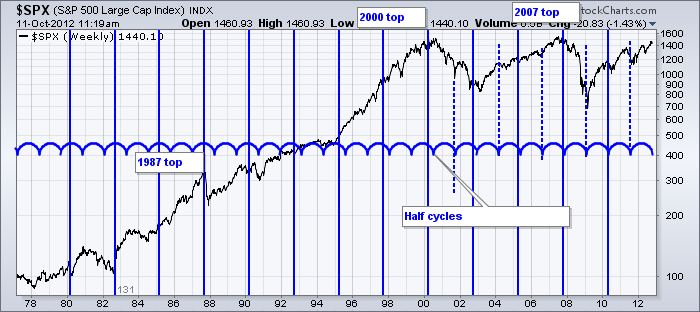
Here is an interesting 131 week cycle.
This cycle seems to be pretty darn important.
It has marked the top in 1987, 2000 and 2007.
It has marked some major inflection points in other years.
The 65.5 week half cycle seems just as important. This marked many high and low inflection points.
What makes this particularly important is that a new line will be in place right about now. What does this mean to us? It could be a significant inflection point. Breaking out of this 12 year sideways range in a meaningful way, or breaking down. I have another long term sycle showing up right about now that marries this time junction of 4th quarter 2012.
More on cycles through the weekend. Writing from NYC Stockcharts.com University course for the rest of the weekend. See you at the Sentry.
PS. My earlier post on the $DJW index snapped through its trendline...I wrote the blog earlier in the week and published it for today on my travel day. What does that mean? it has been a good signal for marking significant tops and bottoms. Arthur suggested the same in a blog recently.
Good Trading,
Greg Schnell, CMT

