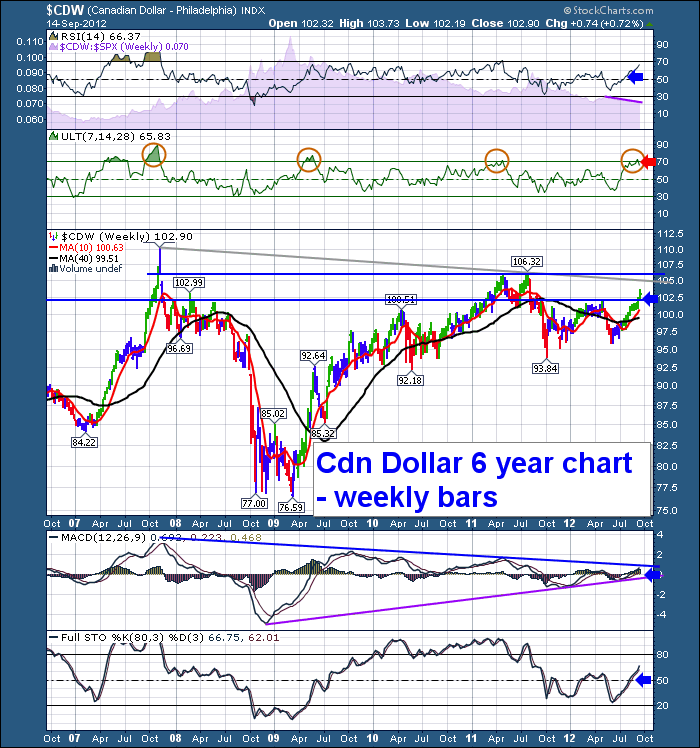
The Canadian toonie has followed oil higher, but the Canadian toonie chart is not really similar to the commodity we nickname Dr. Copper because of its ability to diagnose the economy. Copper only broke out of its range (and what a breakout) in the last two weeks. (right after I published an article saying no surge protection required!)
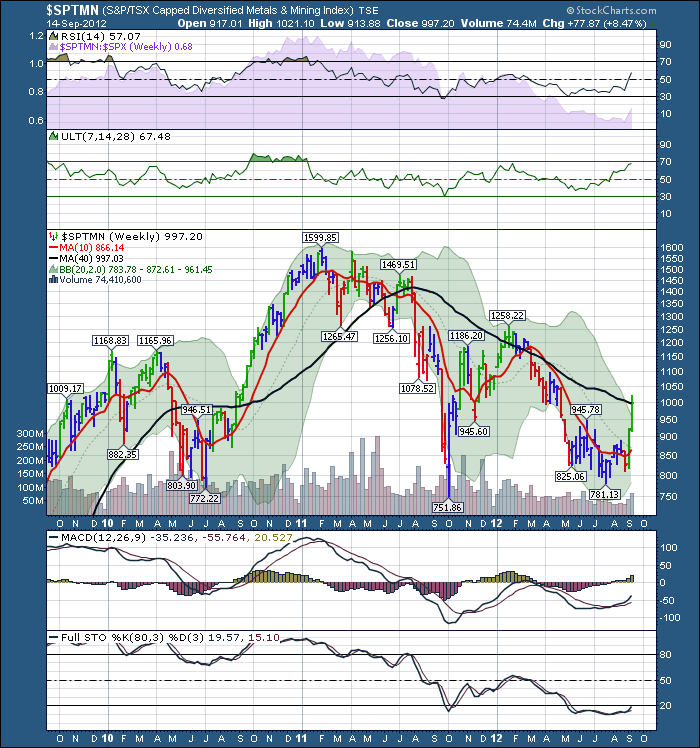
The $CRB has had a nice upslope. which has tracked the Canadian currency. But here is the mining sector. Check out when it broke out.
It finally broke out last week on the Chinese intervention. Up 6 days in a row in a meaningful way. I digress into economic indicator stuff as it helps make the point about the Canadian coin chart and its direction for investing.
With central banks on three continents throwing stimulus into the air, is it time to get long commodities? I have a note on one of my charts that says when central banks are 'investing' Greg should be too.
You'll find this a funny read. $NYAD
Based on my weekly charts, the Materials are all breaking out. When Central banks use words like open ended, unlimited, create inflation, will delay in slowing the economy when it gets going fast, that really does sound bullish. If 3 feds have our back, what's not to like? We'll leave the discussion of hangovers and unintended consequences to the fundamentalists.
Bottom line would be that soaring commodities are going to make the Canadian dollar look more like a nugget than a peso in my mind. The Ultimate Oscillator is one of my favorite indicators to identify overbought and oversold. It looks like the Loonie is looking up but it also looks like it needs a rest here based on the Ultimate Oscillator.
There is a resistance line at 105 and one at 106 and an intraday high around 110. Other than that it looks like the sky is the limit. That's what the central banks want us to think about and this chart is telling similar things. It has cleared through the zone of congestion from 97 to 102. A pullback should find support at the 100 level. We have some MA's there as well as the centre of the consolidation level.
I get the feeling dips will be bought. I would expect some pullback after a rise like this. But maybe this will behave like October 2011. That was a 20% run for the roses for a month! 2/3 of that move was done in 9 days! No pullback to be found.
All that to say it looks like the loonie launch has lifted off! Bullish Commodities, Bullish inflationary assets. Quite a change from the tipping point a few weeks ago where materials stocks put in a long red candle!
Good Trading,
Greg Schnell, CMT


