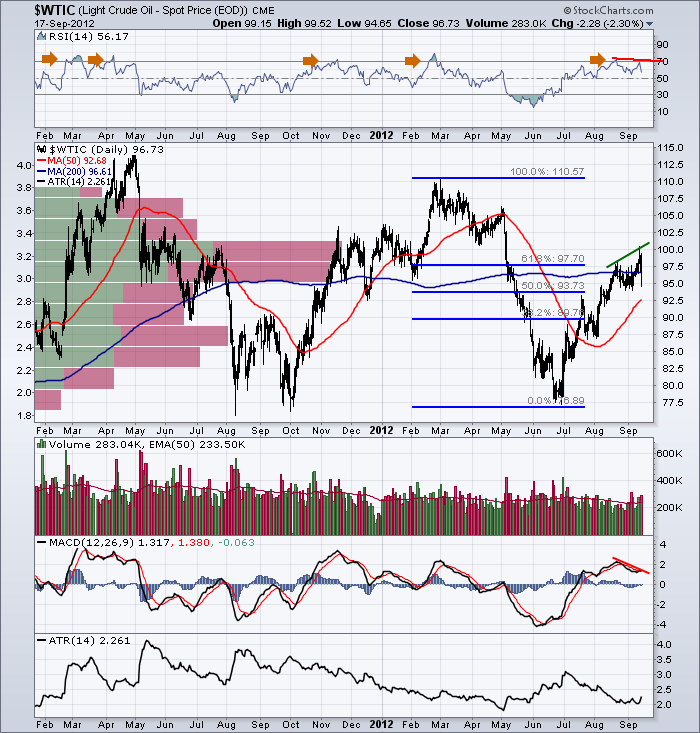
$WTIC had a rough 20 minutes today. I wrote about $WTIC a month ago, Read about it here. (august 23)
A couple of problems that we discussed earlier.
1) When we used a PnF chart to talk about crude it had an upside target of $102.
2) The Red volume price bars said the area of $95 to $100 would be difficult.
3) The 61.8% fib retracement was at $97.70
4) We discussed the MACD and the RSI had no divergences.
5) The RSI does not like to stay overbought. The orange arrows show that is usually the top of the move.
6)Crude would have difficulty getting through $100.
OK. So here we sit a month later.
1) Crude managed to close just above the 200 DMA today after shooting lower.
2) Seasonality suggests crude takes a breather over the next month.
3) The $USD is very oversold currently, so any bounce would pressure crude.
4) The MACD and RSI both have negative divergence now.
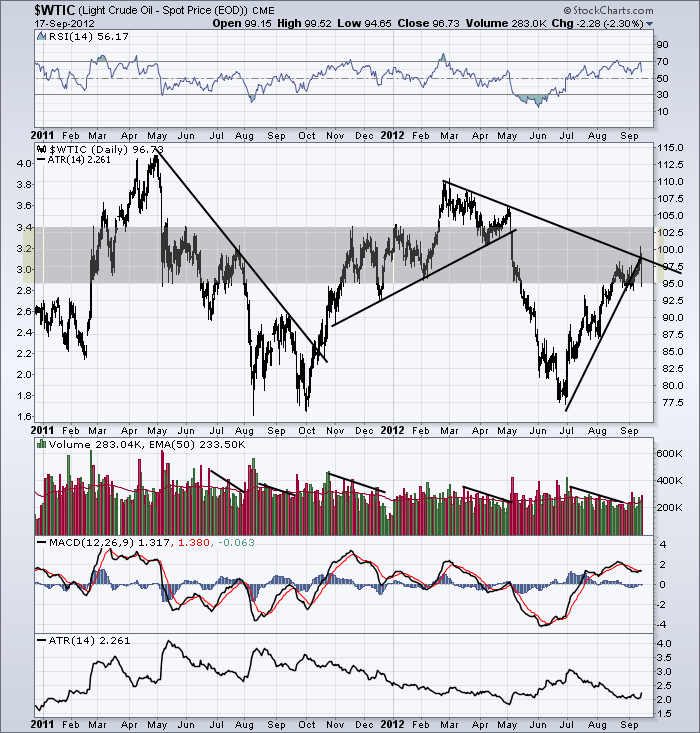
5) Crude tested and failed at the downtrend line so far.
6) The steep uptrend line has been broken. The question is will crude oil moderate and keep rising or fail badly here?
7) If the ATR starts to move higher and break this downtrend, that has been indicative of the end of the trend ( either positive or negative trend).
8) $WTIC is a difficult hold here. If the $USD keeps collapsing, then that is supportive for Crude measured in $USD. If the $USD starts to bounce here ( there is no positive divergence on the $USD chart yet), we would expect a higher low on the $USD MACD before the price turned. We don't always get it, but the selling in the dollar has been so aggressive, it should pause somewhere near here in terms of overbought/oversold.
9) Oil stocks may keep going higher here, but if that relationship starts to break down where oil stocks fall faster than crude, this could be a jarring pullback as just about everyone is long the barrel of crude based on political unrest, the weakness in the dollar, the fed policy, etc. Demand is currently anemic so any stabilization politically would weaken oil significantly. There are many fundamentals, but the chart tells the story.
This reversal off a significant high at the downtrend line, the horizontal resistance, the uptrend line, the volume at price level, the flat 200 DMA, breaking out of a range and failing, RSI reversal at 70, negative divergence, as well as seasonal weakness are an ominous list.
Good trading,
Greg Schnell, CMT.


