As 'The Canadian Technician", I seem to write about the US Dollar a lot. That is because 80% of Canada's exports, all commodities, and seemingly most equities are tied to the tide of the $USD.
Let's start Macro on this blog, and then we'll fill in the shorter time frames through the weekend.
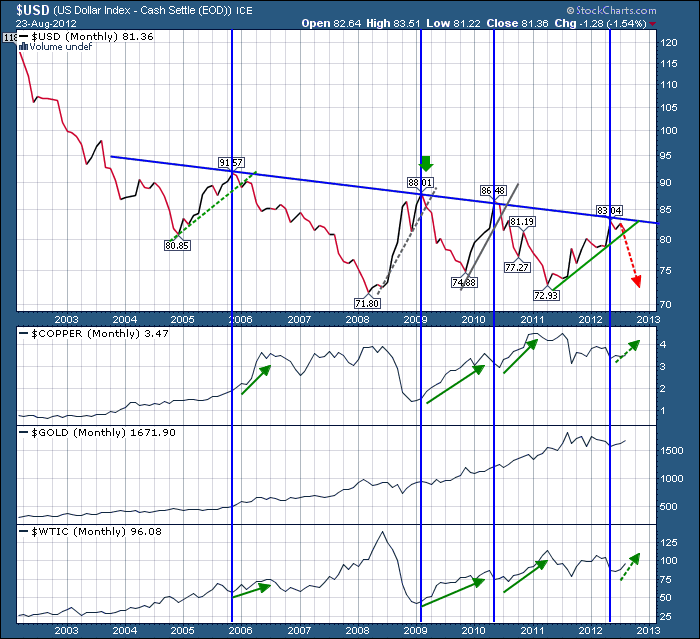
Here is the 10 year time frame chart of the $USD.
This chart has a little too much data on it so let me walk you through slowly.
1) the Blue vertical lines are placed based on the $USD hitting it's head on the line. When I showed this chart previously, it was just as the $USD reached it.
2) The $USD has had two different slopes on the rallies off the lows. The current slope of the green line duplicates the dotted line from 2005. For those that don't remember, 2005 was a sideways year that soared throughout 2006 and into 2007. You will also notice the two black lines hold identical slopes. Those produced beautiful rallies that were exceptional in size and scale.
3) Obviously, I could plot downward trendlines on this chart as well. It seems the breakout dates on those were also significant but we are currently looking at topping action in the $USD and trying to figure out if it will hold at this level and stay on the upward trendline, or breakdown.
4) the red dotted arrow is what we are watching for. If that happens, we would expect the corresponding green arrows to show their complicit action. So we want to be ready to place those MACRO ...MACRO >>> MACRO trades. This is a long term monthly chart which does not help us much in the 60 minute world. But understanding the key timing of the inflection point that we are currently at is pretty important.
Tomorrow we'll analyze the weekly view with this in mind.
Good Trading,
Greg Schnell, CMT


