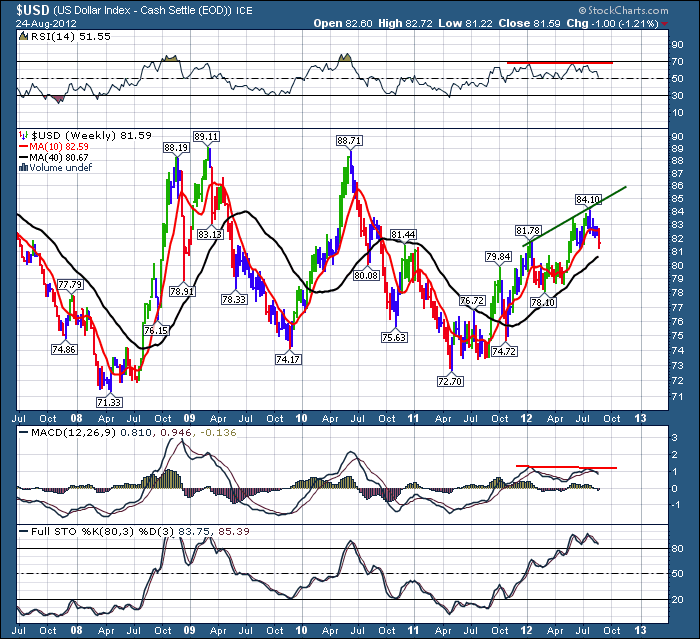
One thing that I absolutely love about Stockcharts.com is the ability to save multiple charts of the same stock, currency, commodity or index. It allows you to have different ideas on different charts so you can explore different ideas at the days progress.
Below you'll find a few different looks at the $USD weekly.
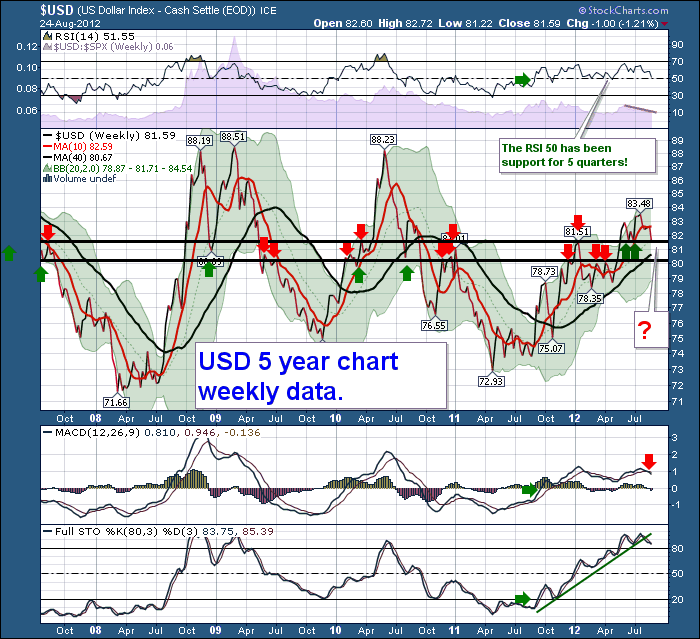
So we currently sit at the zone of support on the weekly. Remember on the Monthly how we pulled back from the 10 year downtrend line? Some serious competing trends going on here. Where did we close on Friday? Right on horizontal support!!!!! So, a little bounce is possible here. A realistic place to put on a go long trade. If I am wrong, I know quickly that major support did not hold and exit the trade with an extremely tight stop loss.
I want to draw a few more lines on this chart but it is so busy with the data I already have on it, I'll put up another chart with more info. Before I leave this chart, look how strong the 50 RSI line is. Major support there as well. Ver-ry Int-teresting....with a Sargeant Schultz accent....!
MACD just crossed below the signal line and the Full sto's have broken the uptrend, but are still above 80. Not a place to go short with all of these support levels below.
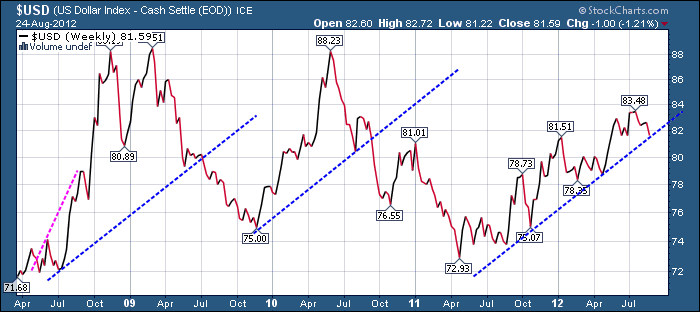
Let's check out the slope of the advance.
This is interesting, This is the least aggressive advance of the $USD. The previous ones were very vertical, and by the time it got to the same slope as the current line, it was already in a major downtrend. Glass half full, could be a major advance with a normal slope to it, or much less aggression on this advance and ready to roll over. That is why we use trend lines. If it breaks down here, it is an important break and we'll probably see more downside.
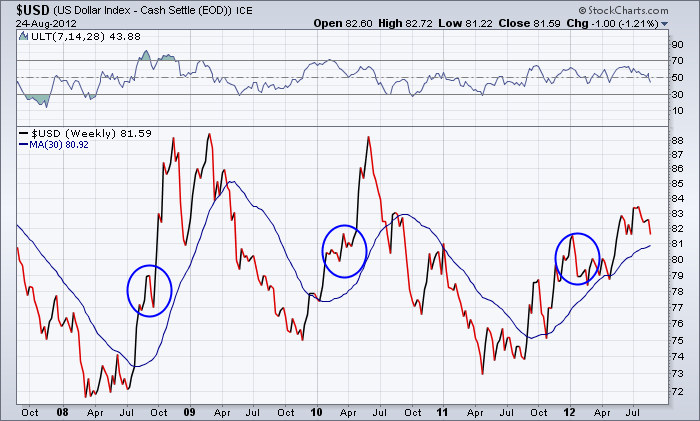
Here is another chart with a 30 week MA overlaid on it. I am looking at how well it does at setting the peak of the downtrends. Not quite as tight on the uptrend, but a fail below the 30 week is pretty important too. In this recent rally, the 30 week has been support.
So this would give a little more room to the downside before a sell signal was initiated.
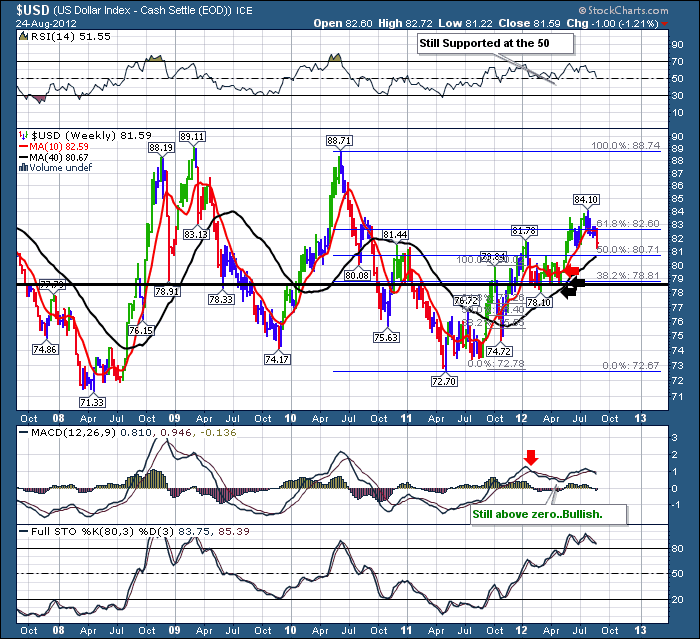
Here is the $USD with Fibonaaci levels on it.
What I notice on this chart is that the 50% fib and the 40 week MA are just below. So remember the two horizontal support levels above? Well, the fibs are very close as well. If we do the fibs just of the recent price action of the last move up, that would be another fib level. The bottom line is that there is a veritable fortress of support levels at or just below the current price levels. So this should just bounce higher and commodities fall apart. OK. I'll trade that! So what have I missed?
The alarming negative divergence on the MACD.
Ignoring major divergences on a MACD is not the best thing to do! We noted that this advance has been much more moderate than ones in the past. DId they also suffer negative divergences before they rolled over? Well, the first one did and the second one did not in 2010!
Two things I am thinking here. If the Negative divergence plays out, all these trendlines will be broken to the downside. If they get support, then the MACD will just continue to oscillate sideways. Either way, we can use this group of charts to tell us if the rally in commodities is going to be over or is just getting started. That's a pretty nice signal! Let's check on the daily tomorrow.
Good Trading
Greg Schnell, CMT

