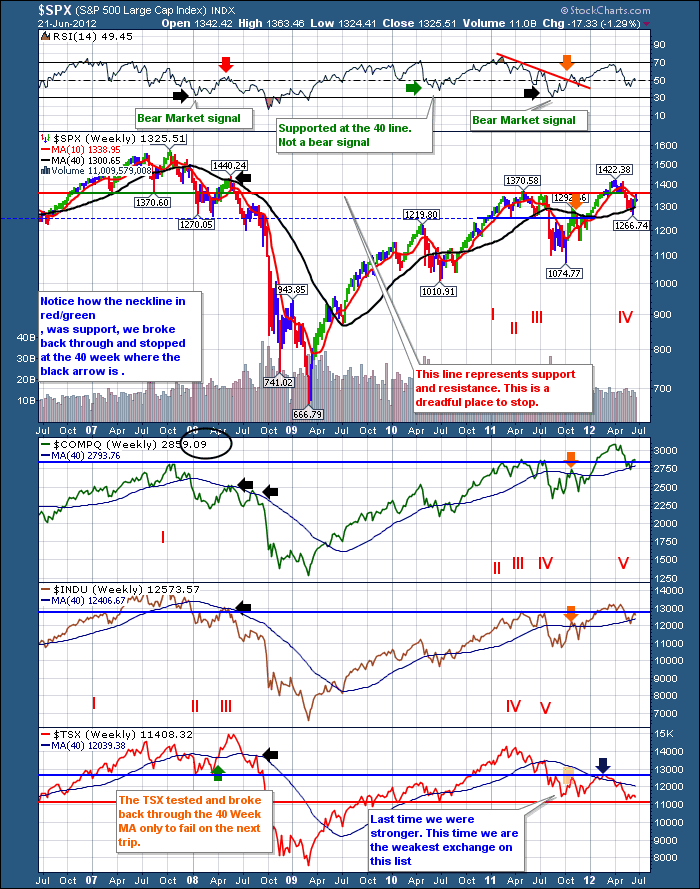
As a technician, we see things as levels of support and resistance.
Yesterday's price action made the summersolstice the longest day for equity traders as well as the price just continually declined all day. Crude oil continued to decline and lost $5 in 2 days.
But more important than having a bad day, it was where on the charts the market had a bad day that makes it so disappointing. We appear to be setting up for a multi year top. Monday I was getting more bullish, the price action across the globe has dramatically influenced my hopes for a new bull. It looks like we'll muddle around here for earnings and head south for a while now. While the US markets remain the only markets with upsloping 40 week ma's, they also have the privilege of being the only markets above the 10 month MA's as well. Look back to the end of april blogs to see why that is significant.
Briefly look at the $TSX first down at the bottom. Notice how we went above the blue line in 2011. Life was good. This was the support line for the 2007/2008 top. That line has become significant resistance for us all during the last year. Notice how the bottom red line would now be considered the support line for the 2011 topping process.
Well, when we loooooook way up to the $SPX, We'll notice how it managed to also push above the support lines for the 2007 top. We got so bullish as it went above the 2011 top. I wasan't convinced it could make it back above, but it did. Now we are testing these levels from the bottom side. Yesterday seemed like a clear fail and the global price reduction in crude oil is telling us something bigger than a mid summer nights dream about low priced oil for consumers. One more thing. Notice the dotted blue line on the $SPX chart. This is why Golman and Citi both announced the 1270-1275 level as critical support. If the Federal Reserve owns a chart book (they definitely do), they'll be watching this level.
You can see on the $COMPQ how the level is important, but more so because it marks the 2007 highs, 2011 highs and currently it would make another failed breakout above that level. Apple fans unite. We must keep this index on the rails! Notice the count in red roman numerals of how many times this line was tested.
On the Dow, the story differs slightly. You can see this level is below the 2007 support levels, but this level was still tested 5 times. Resistance here is terrible. A fail would probably announce the end of the rally we have looked at for 3 years.
Heads Up, it could be a cold winter for the equity in your account. I would expect some type of government support around the 1275 line. We'll have to see.
Good Trading,
Greg Schnell, CMT.

