The whole world is trying to figure out if Europe can save the Euro. There are a lot of people trying. That backdrop sucks up all the media time. It's hard to get bullish with the news.
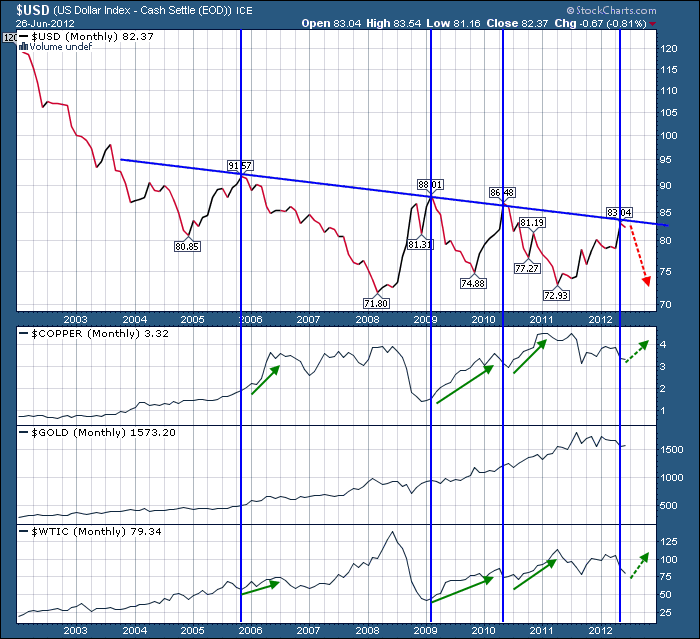
But here we sit with the $USD up against a major resistance trendline. If the $USD chart stalled or falls at this level, it should help the commodities or the mineral miners. I don't know if its a new bull market, but if the USD kept falling as it has done 3 previous times at this line, it would be bullish for commodities.
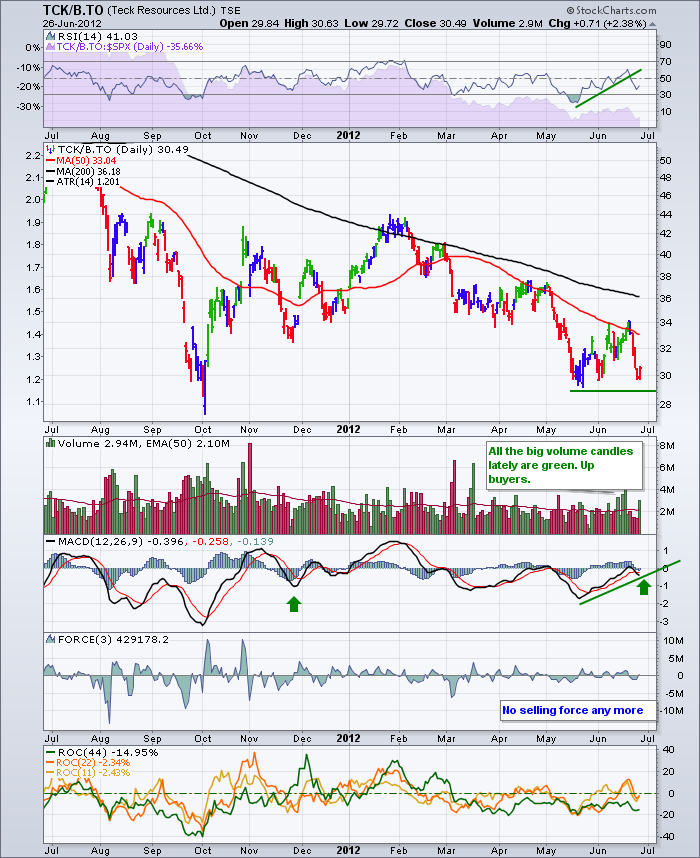
Copper was actually up on Mondays selloff. The other thing to notice, is that the miners are not getting big force on the selloff during the recent slides on Thursday and Monday. The daily chart is compelling on TCK/b.TO to check the MACD.
This morning I was very bullish after looking at many of the commodity charts. There are many charts with interesting MACDs right here.
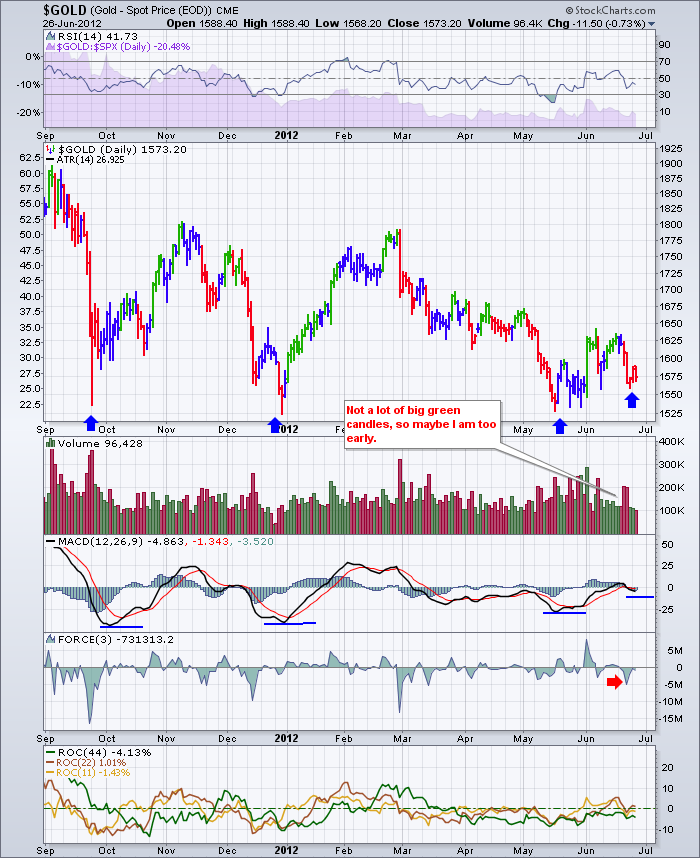
Here is $GOLD.... I haven't been a big gold fan for a long time. Recently, I suggested $gold was giving big buy signals. But you need a tight stop because of the market volatility. Well, $GOLD has continued to pull back. It is very, very interesting here with a stop! Look at the position of the MACD right now. The price is near the lows, but the MACD currently is just below the zero line.
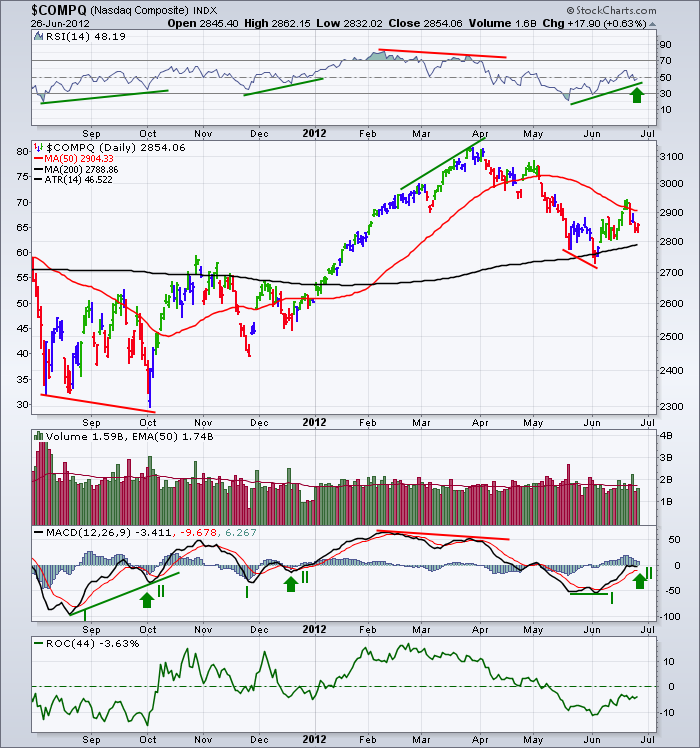
Here is the $COMPQ with this same MACD pattern. I love this pattern of a higher low just below the zero line. It means the selling is subsiding, and the market is trying to rally. Oct 4 2011 was a great example.
Now the MACD can just keep rolling over as the price collapses and make new lows. But the recent big down days scared almost everyone. There should be lots of short positions that would be forced to cover giving the rally a new surge.
My long term big picture is that we are below the 50 day and the 200 day on the $TSX. It is a down market. We do not know how long the rally will be. It does not matter as Europe keeps delivering the chop to this market. It is a nice place to enter a long with stops close on the commodities. If you get thrown out, so be it. If your right it could be great timing.
The MACD's are all in the right position, BUT the price action has to start turning higher to change the trend.
Be open to the upside when everyone else wants to sell. The early part of the rally can be very profitable. If you are wrong, the tight stop helps you exit quickly and protect capital. But currently its a trade. All the moving averages are downsloping and that means trade, not buy and hold.
Good Trading,
Greg Schnell, CMT


