$Gold
This shiny metal is really keeping us guessing as to where it is going.
Today marks another very important point on the chart. Let's drill into it and see what's going on.
Here is the same chart zoomed in on the final year.
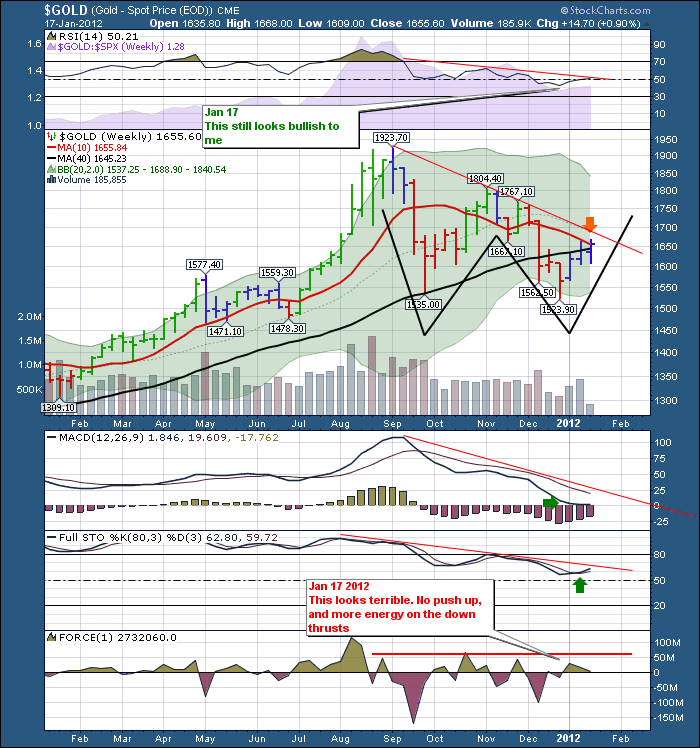
Let's discuss the charts above before we look at other data.
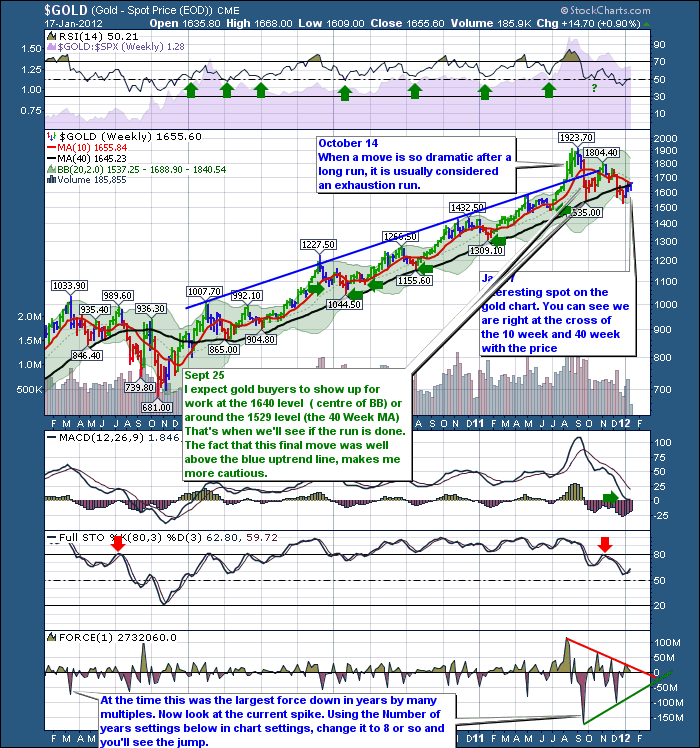
Obviously the long term chart shows a fabulous run.
There are a few events that stick out on the top chart that we need to point out.
1) A final gasping push up like $Gold did in August and September of 2011 is usually associated with a top. The push out of the channel was substantial and lends more credence to the finality of the event.
2) From there, the stock clearly pulled back below the 40 Week ma and stayed below the ma for more than a month. The centre line on the MACD, is very important. It appears to be getting support there.
The RSI held up above the 40 level which is important. This gives me some comfort that we can rally from here.
Let's zoom in on the second chart.
A) The first thing to notice is the meeting of the 10 week and 40 week ma. This is usually considered bearish. Just to add emphasis, the price is sitting right there this week at the junction point. This just adds importance to this level and breaking through would be very bullish.We also have a downtrend line off the lower highs trendline in red and that makes this resistance even more significant. One positive trait is the 40 week is still clearly on an uptrend. Lastly, The centre of the Bollinger Bands is sitting just above all of this. This usually is support on an uptrend. Now that the 20 week MA dotted line which is the centre of the BB is pointing down, this would also be significant resistance.
Next, let's talk about a price pattern. The Gold price made a double bottom pattern, which I have silhouetted with a black 'W' shape in the chart. This can be a very powerful pattern. What makes it an even more powerful pattern is the right 'low' undercut the left 'low' by $15 so anyone who had stops just under the left side level would have been triggered. This gets rid of the weak holders.
B) Let's check the indicators. No volume came in on the low, but it was over Christmas so I have to disregard the volume data. The RSI line has lost its upward momentum and appears to be laying down for a sleep at the 50 line. That is not good on a weekly chart. The purple silhouette on the RSI chart is the SPURS. Relative strength compared to the SP500. You can see it is still underperforming the $SPX. It is making lower levels of strength on every push up. Fund managers like to buy things with strong SPURS, not weak SPURS. Both of these look weak.
The MACD is still heading down at a strong angle. The fact that it has flattened at the zero line is something I like. It is really important for the MACD to turn higher here. This particular turn is one of my favorite areas of support on a chart. I like when the MACD finds support at the zero line.
The full stochastics tested the 80 line from the underside, and turned down. That is very bearish and is similar to the price action in 2008. As long as the Full sto's can get support above 50 that would be very positive.
The Force indicator shows no real bull energy here. So I don't like this data. But force is a function of volume and the Christmas season was muting volume. $GOLD measures future contracts. We can look at GLD to see how retail investors are positioned with ETF's like GLD and GDX.
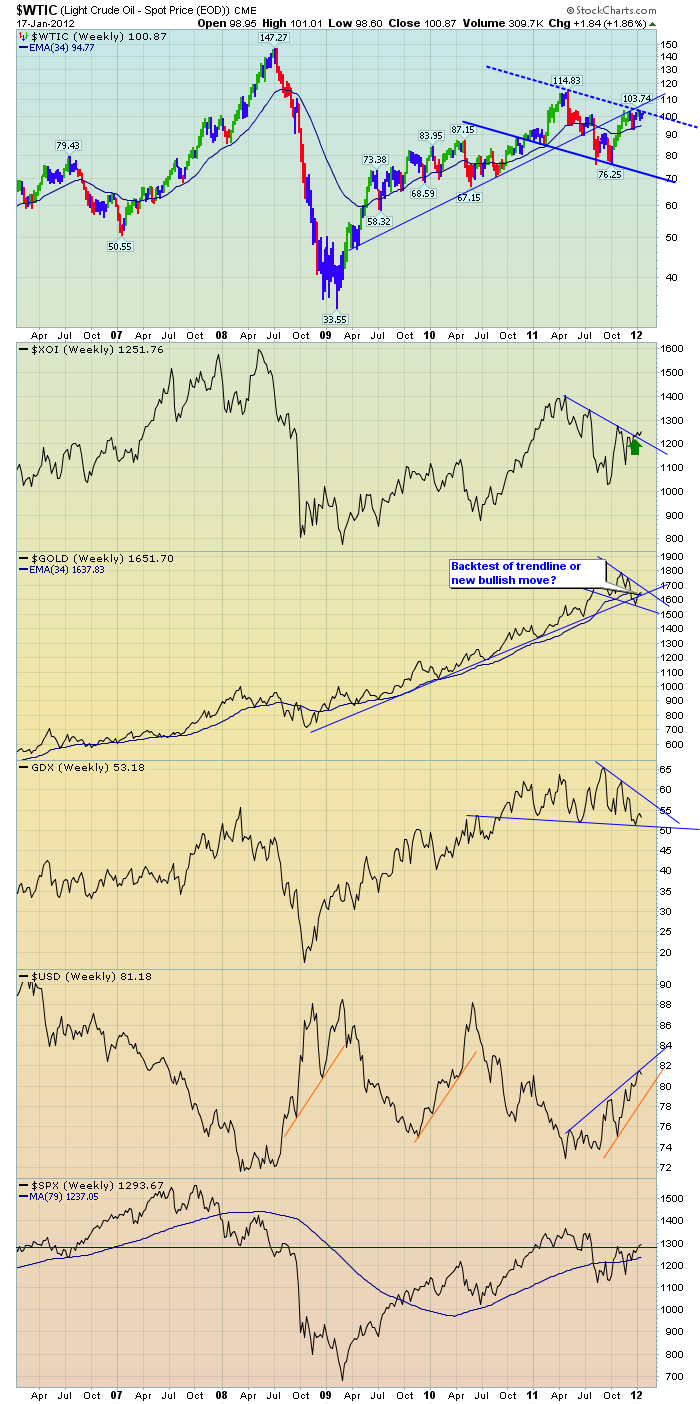
First, let's look at one other chart.
What I notice on this particular chart is the $USD has started an uptrend and everything is pulling back. Now into earnings season, the overall market likes to run up. You can see the SP500 is where it started 2011 and right at major horizontal resistance.
So with the $USD pushing higher, I am reluctant to be a $GOLD buyer.
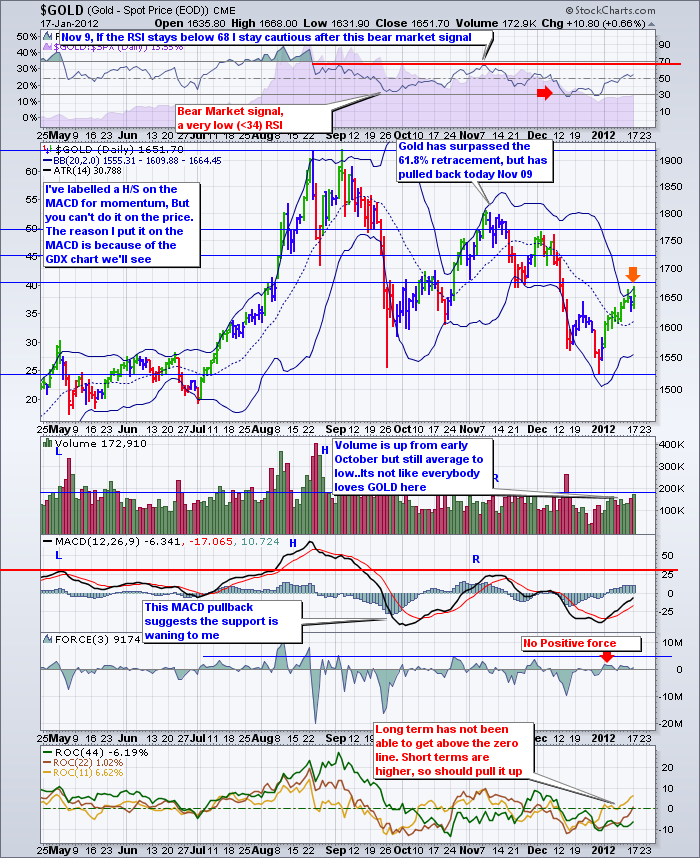
Here is $GOLD Daily
Even on the daily things don't look great. I expanded my Fibonacci lines from the low of Sept 26 to the low of December 28. You can see we are currently testing the 38.2% retracement.
The fact that the volume is still low, the force is low, no divergence on the MACD, and the RSI is flatlining on the 50 level concerns me a lot.
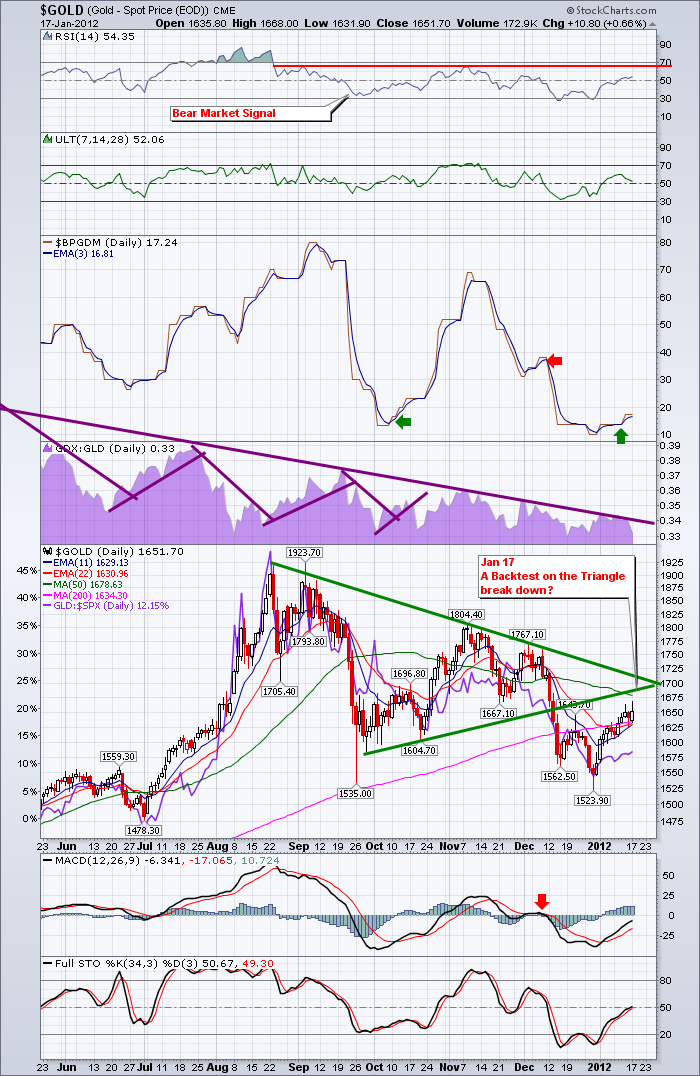
Here the $BPGDM is breaking out. The GDX:GLD ratio continues to decline which is not good.
The price action on the daily is interesting. We can see the big Green pennant pattern. Well, it clearly broke out of the pennant to the downside. IS it coming to test the triangle at the apex of the pennant? THat should be resistance. maybe it just makes an end run and goes around it. The apex, the 50 dma and the Fibonacci retracements are all right here in this zone, so $GOLD probably needs some ferocious buying to show up and push it through resistance.
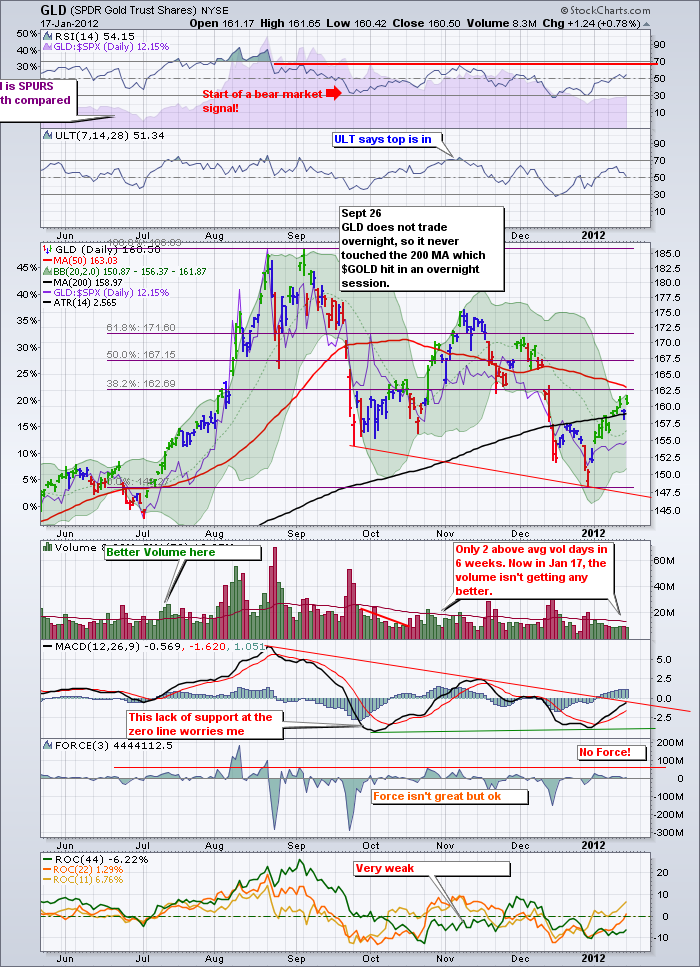
Here is the GLD.
The GLD shows some positive divergence on the MACD which is better than the $GOLD which trades in overnight trading. So that makes me a little suspect on the divergence as the price actually made a substantially lower low overnight as seen on the $GOLD chart above. The MACD does look like it might break above the downward sloping trendline.
I think the real problem I have is no one is desperately buying gold on this great opportunity here even with everything rallying. The SPX is up, but gold has had below average volume for 2 weeks without exception.
If I had to buy gold long or sell gold short, I would probably try to sell gold short at the 50 dma, the 38.2% fib line and the triangle line from the chart farther up. Using these as overhead resistance, I might trade against those lines. If Gold can make it through, then I can stop out with very little loss. I just don't see anything compelling that says go long here. The September, October, November and December months all had a rally started roughly in the final week. Maybe that is when GOLD can push through all the resistance.
Overall, my general view is that the market has lost its upside momentum here. It may creak a little higher, but it feels topping to me. i was not at all impressed to see Friday work so hard just to rally half way back. Then today we gave back almost all of the premarket gap up. When you start up a 100 points and almost lose as the day drifts lower, that is weak action.
Bullish investors are at 6 year highs which is euphoric considering what we have been through in 6 years. The list of bearish market developments at Sentimentrader is long, which is not good either. My personal market system gave me a sell signal on Friday after the close. It stayed on sell after todays push up.
Oil hasn't made any ground for almost 9 weeks now. It has traded in a range between $96 and $104 oscillating across $100. Friday it made a three week low. If the last 4 weeks lows are taken out, I would expect a significant move down. Conversely, a break higher would help me get bullish.
Lastly, the bond chart refuses to budge. The 10 Year is stuck at 1.86 level and doesn't seem to be experiencing any selling. The Fed meets next week. Do the primary dealers know something already so they have decided to hold on to the bonds?
The technical community is divided here on direction. I know one technician who moved to fully invested on Friday with the SP500 trading above the 200 DMA.
I am still in the camp that this is a rally into earnings and we will pull back before month end.
Tough market. But we can trade what is working. We can trade against trendlines for support and resistance. We can place stops in good areas to protect our account. We can put some hedge positions on to protect us against downside moves. The only damage is staying fully in without any protection.
Good Trading,
Greg Schnell, CMT

