We had a significant marker happen this week. Let's look at how to deal with it.
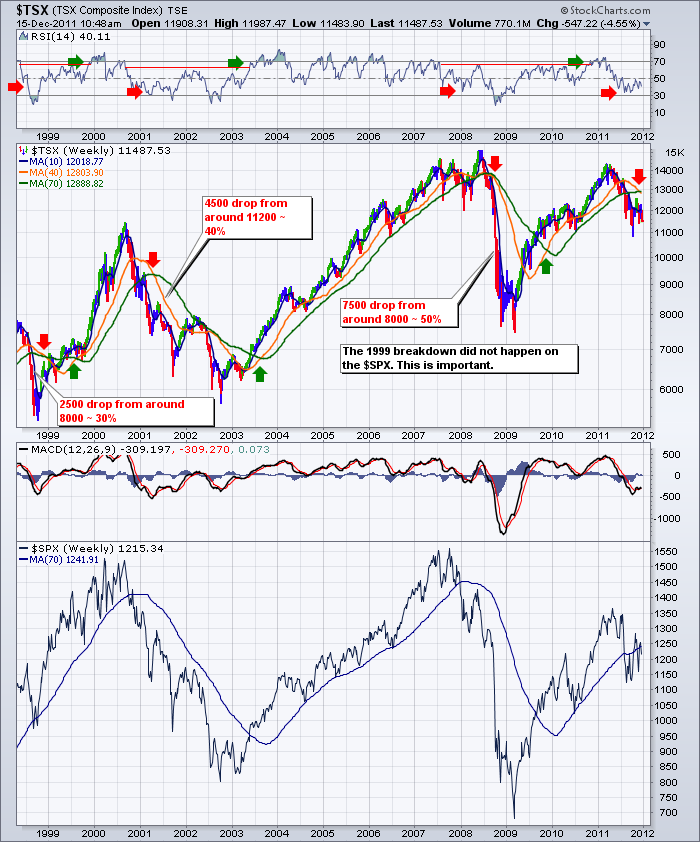
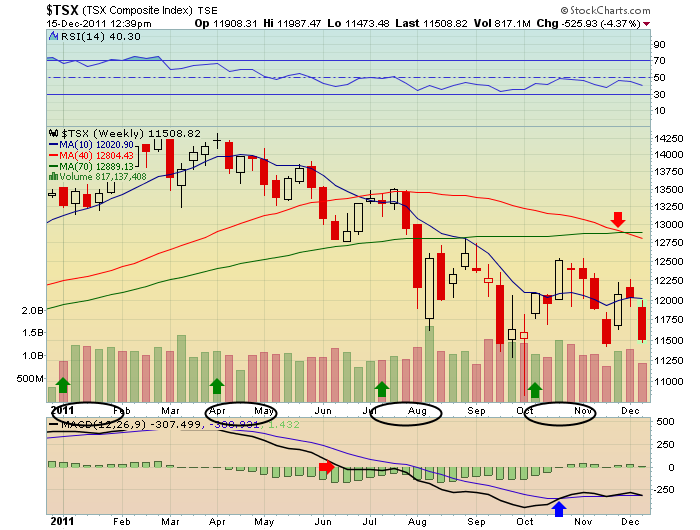
First of all, here is a chart going back almost 14 years.
Notice how significant it is when the 40 week crosses below the 70 week. Why the 70 week? Well, that is where the price gets supported during all the upswings and where it fails at the top.
Let's review three things on each chart.
1) What was a good sell signal?
2) What was a good buy signal?
3) What other clues are on the chart.
1)When the first moving average (10 Week) rolled over, that is a problem.
When the 10 week cross below the 40 week, that is usually a bear market signal.
When the 40 week crosses below the 70 week, that is very bearish.
However, when the price action fell quickly below the 10 week and 40 week it was notable. That price drop also happened during the third week of earnings.
The RSI had not given a clue that this pullback would be severe. It stayed above 40.
The MACD had pulled back just below zero then rebounded. When it fell hard below zero, that was also a late but important clue. The Histograms behind the MACD began rising later on so the momentum down was slowing.
2) For Buying signals, The RSI coming out of the oversold was a good signal. The MACD cross was slower but important. I like the slope of the MACD black line. When it turned up from negative at such a deep oversold level, it was a great bounce. The moving averages provided resistance then support as the price moved up. The slope of the MACD black line helps at most turning points. For longer term investors, The critical area is the MACD getting back into positive territory.
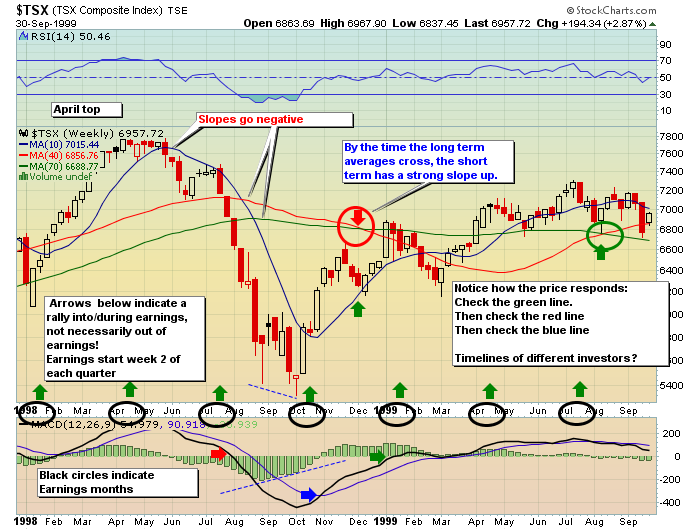
3) I like to look at behaviour before and during Earnings. All 8 of the earnings quarters here had the market turning up BEFORE earnings. This is signified by the green arrows.
Here was the Result.
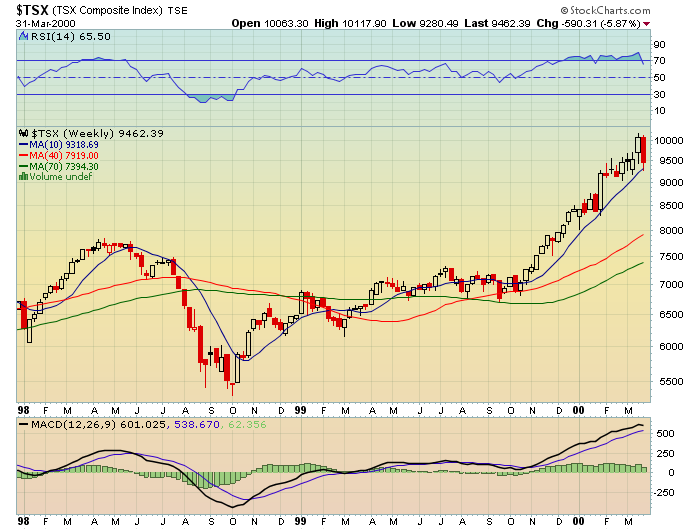
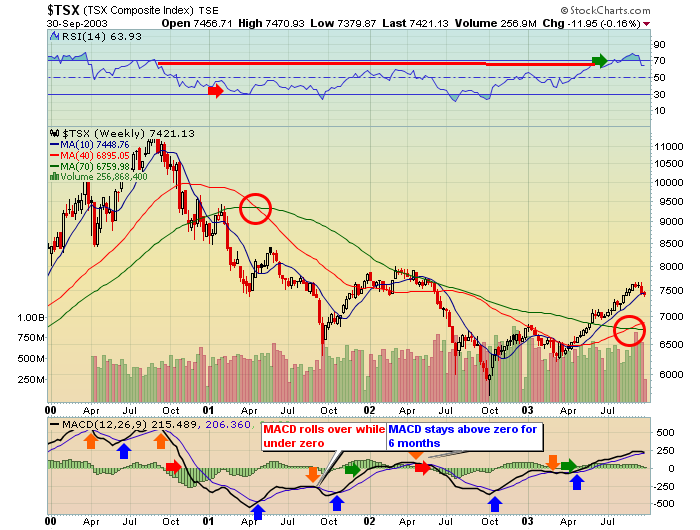
Let's look at the 2000 top.
1) Sell signals. The 10 week crossing down through the 40 week was very bad. When the 40 week crossed down across the 70 week, that was very bad. Price going below the 40 week was very important. When the MACD was below zero, that was important. Again, the slope of the MACD while below zero was important.
2) Buy Signals. The slope of the MACD black line was the best for quick traders. The markets did not go up into every options expiration. It did go up on 4 out of 7.
3) Lower highs and lower lows were very obvious. the Previous high was never exceeded.
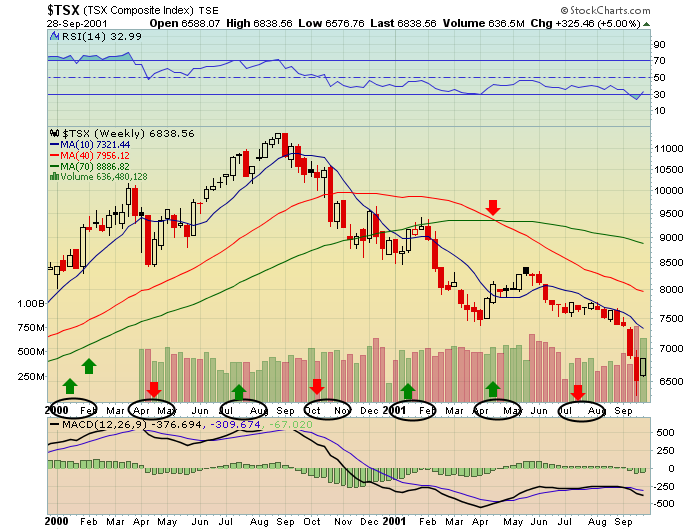
Let's see what unfolded after the 40 week line dropped below the 70 week. It was a much longer road lower. Almost 2 full years.
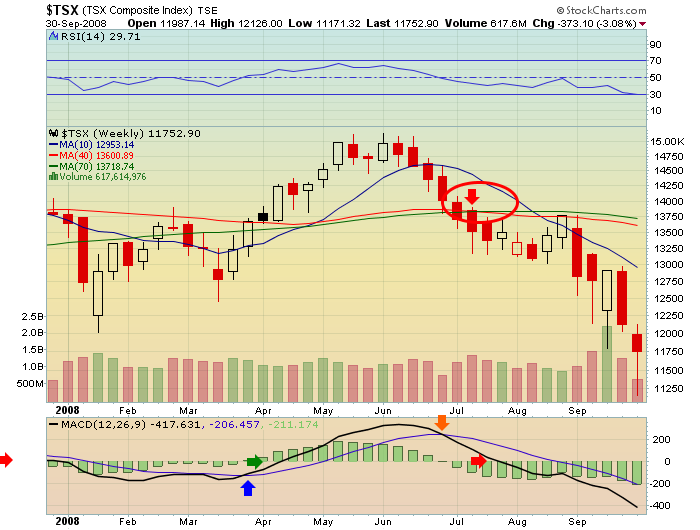
Ok. lets look at the 2008 top.
1) The sell signals were good. First of all the RSI gave us a major sell signal by falling below 40 in January. The RSI topped out right after the April earnings run. It drifted sideways in early May.
The MACD going below zero was a sell signal. Notice the last push up on the MACD. A strong cross signal. However, it was after the price had fallen below the 10,40 and 70 week Moving averages. The MACD under zero was a clue that all was not well. That should have been a strong warning to sell into strength or at least tighten stops after the market went sideways for 6 weeks at the top. Easy to see afterward.
OK. here is the 2008 result.
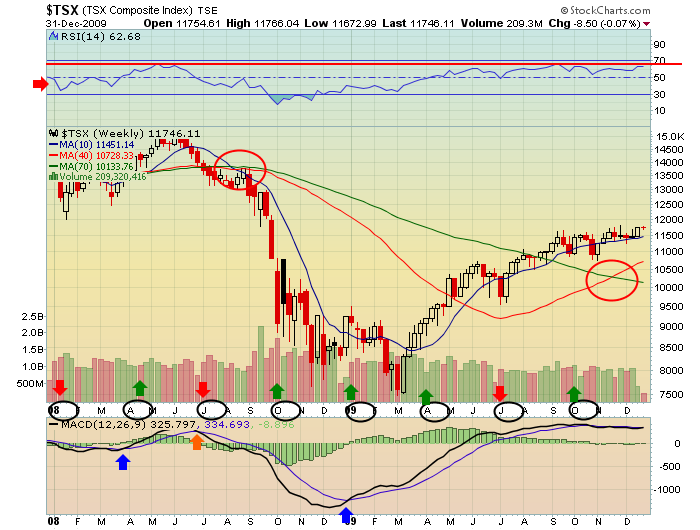
2) Buy Signals. The MACD never turned up to positive slope until mid December. That was a potential buy point. The price when it broke above all 3 MA's was pretty good! The MACD slope up and a cross of the signal line was also good. Some might use the RSI going back above the 50.
3) This market topped in May / June and did not rally into earnings in July.
As we know, the market bottomed in March 2009, so that was an early signal. The rally in January earnings was compelling. 5 of 8 earnings periods had rallies into earnings. The October one was hard to see but in one week it moved 2500 points! Obviously the March rally was a big one.
So where are we now?
I expect a higher high, but the 'bounce on the MACD hasn't been enthusiastic. The 10 wk below the 40 which is below the 70 is not good. The strength of the US economy seems better, so I would expect some of these money managers to push up the market going into earnings again like they have done in the last four quarters. We'll see if they can do it.
So how to trade this market? Bear market rallies are vicious reversals so being short is hard. If we can bounce up to test the 200 dma, that will be good. I expect sellers to show up in a big way if we can not make it back through the 200 DMA.
What will you do? You might need a plan. In the meantime, traders will have to respect the cross of the 40 week below the 70 week as bearish. This cross puts the 10 below the 40 and the 40 below the 70. This downward configuration is a bear confirmation.
I expect some rally into US earnings as the US market has had some positive indicator readings as of late.
Good Trading,
Greg Schnell, CMT

