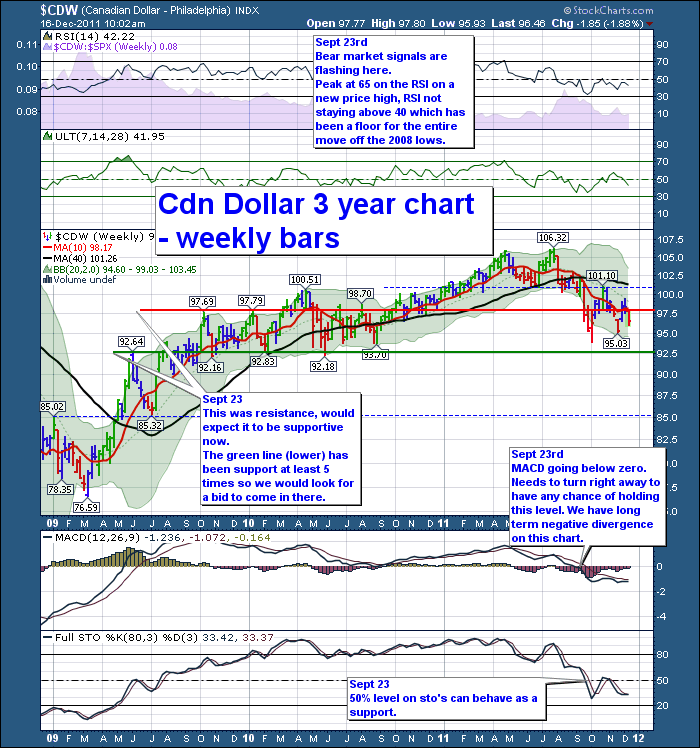
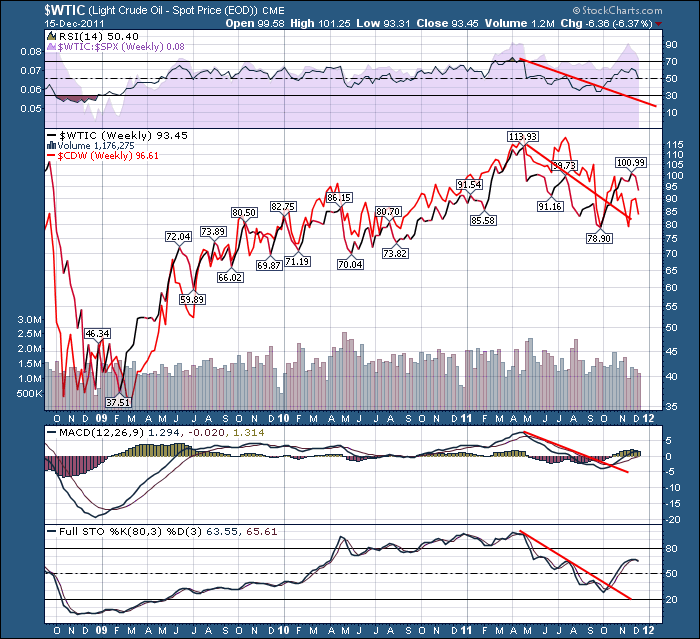
The Canadian dollar is a strong tracker of $WTIC. If oil pulls back here, the Canadian dollar could as well.
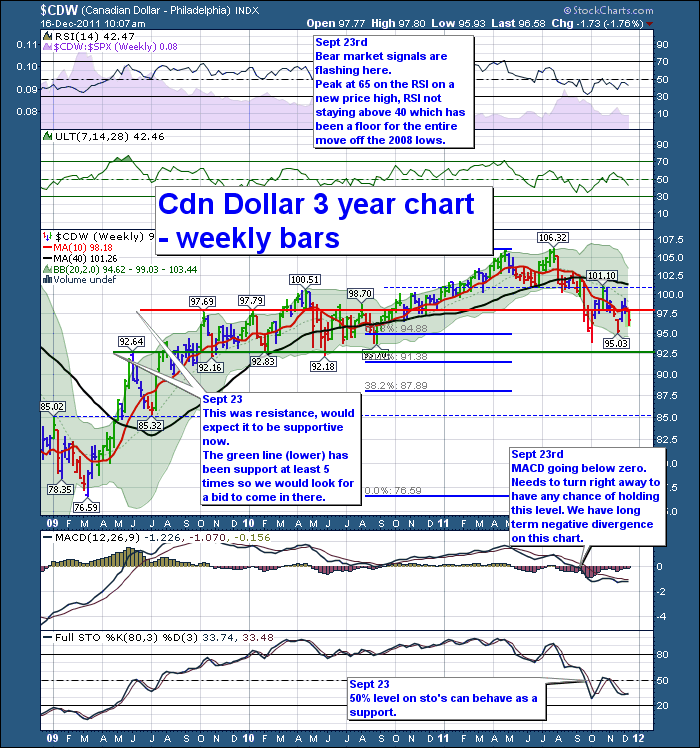
This top chart does not have the Fibonacci levels. The one below does. You can see how the Fib levels help you find other areas of support on the chart.
I'm staying with the ranges posted at the end of the last quarter.
Double top level = 106
Intermediate ceiling =101
Major resistance =98
The Fib Levels, drawn on the chart below come in at 95,91,88
Support = 92.50
That 95 fib has been hit twice so it is becoming good support.
A break of support looks painful in the $CDW.
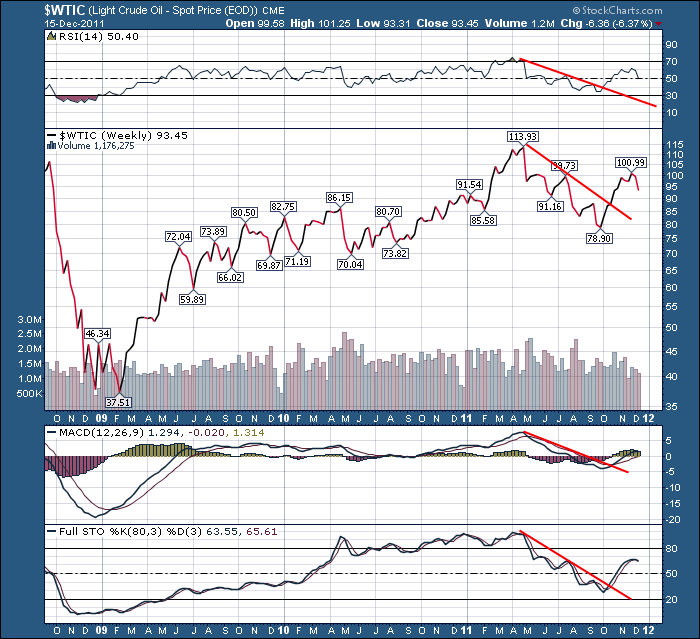
$WTIC dropped below it's 200 DMA or 40 Week MA this week. That is of concern.
Bottom line. Price of oil will direct the looney toonies.
Here is a line chart of $WTIC weekly
Here is the crude chart with the Cdn $ in Red. Looks like the currency market has already priced in a lower price of oil.
Booking a US Vacation? Check the price of crude oil.
Good trading,
Greg Schnell, CMT


