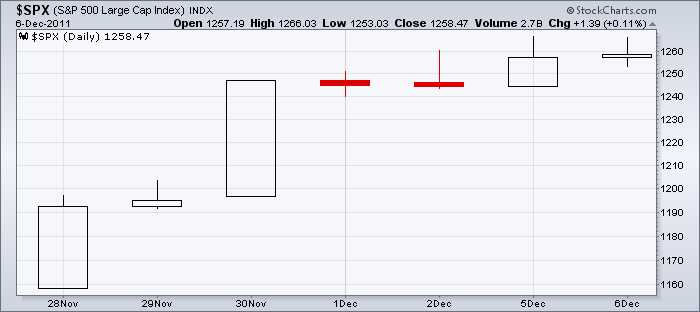
Here is the $SPX chart since the low of November 28th.
The SPX has moved exactly 100 points from November 27th close to December 6th close.
89 points of the 100 points happened in the premarket if you include the first 5 minute candle of each day while the market opened. The remaining 11 points happened while the market was open.
If you use time, 11 points took 94% of the time, and 89 points took 6% of the time.
The reality is the shorts have closed their trades causing the surge at the open. Only 1 day of seven did the market close with a gain more than 3 points after the original 5 minutes. However, there were 2 days with a loss of 5 points or more.
I have never seen so many talking heads talking about how good the market looks here. Europe will be solved on Friday, the Fed will launch QE3 next week and we get a 50 point cut from the ECB. Bullish, Bullish, Bullish.
So why is the market so quiet while it is open? I think it shows in these charts.
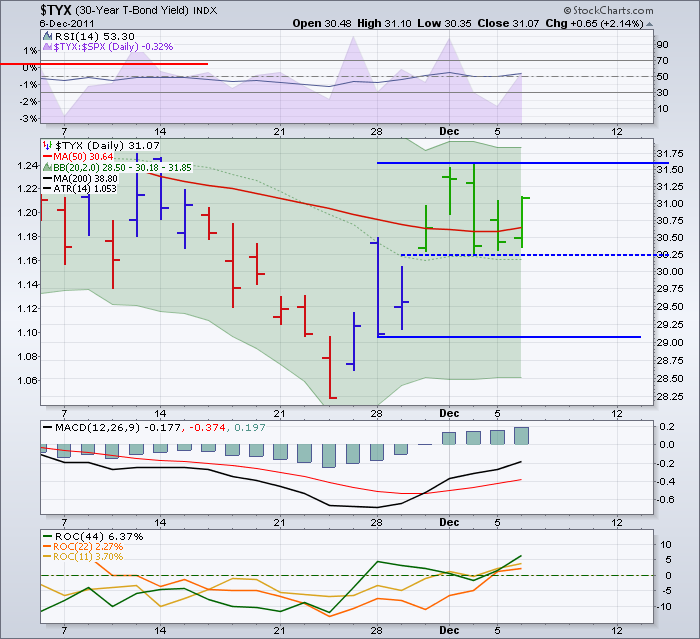
The $TYX 30 year bond has not changed much since the two major surges of November 28 and 30. See the dotted line.
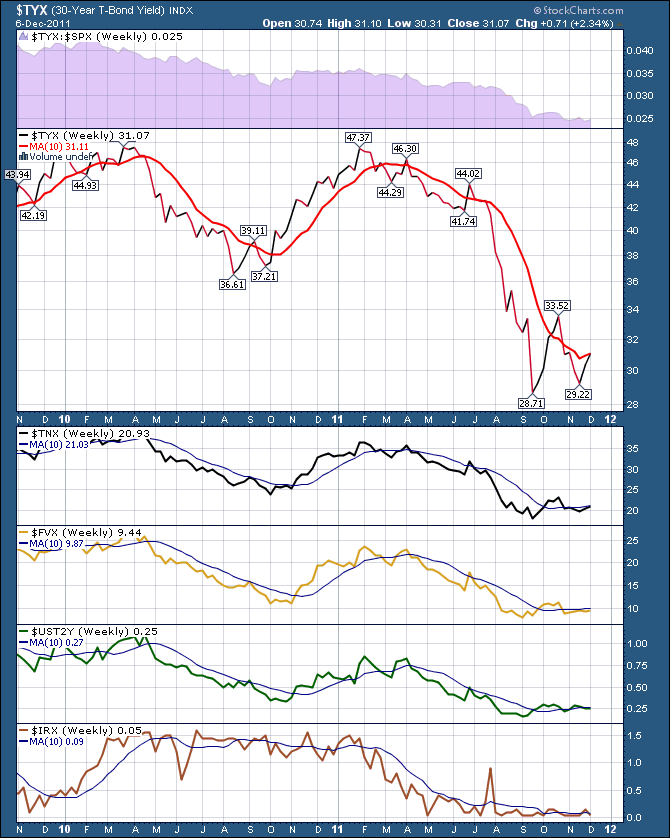
Here is the bond dashboard. No real progress after the initial move on any timeframe. In order, 30 year, 10 year, five year, 2 year, 1 year.
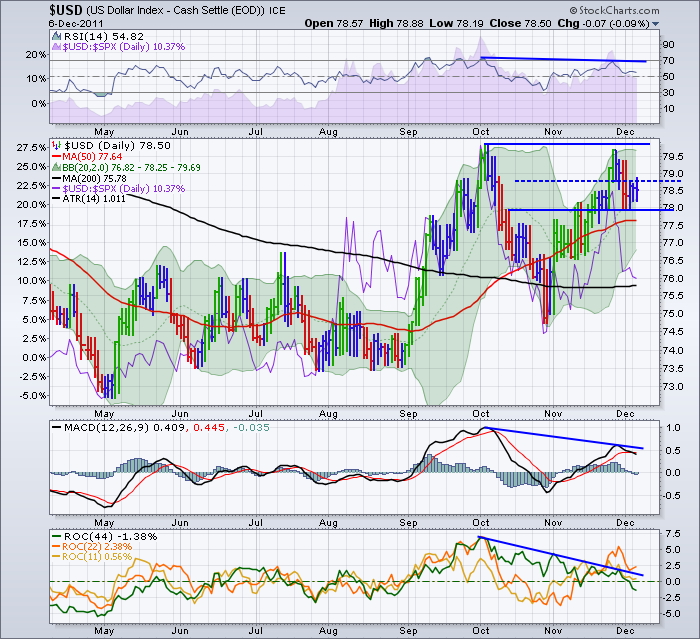
Here is the $USD. If anything it surged higher today. Technical trading checking for stops? By that I mean it pushes up, takes out the easy stop positions above the highs of the last 2 days, then falls back into the range.
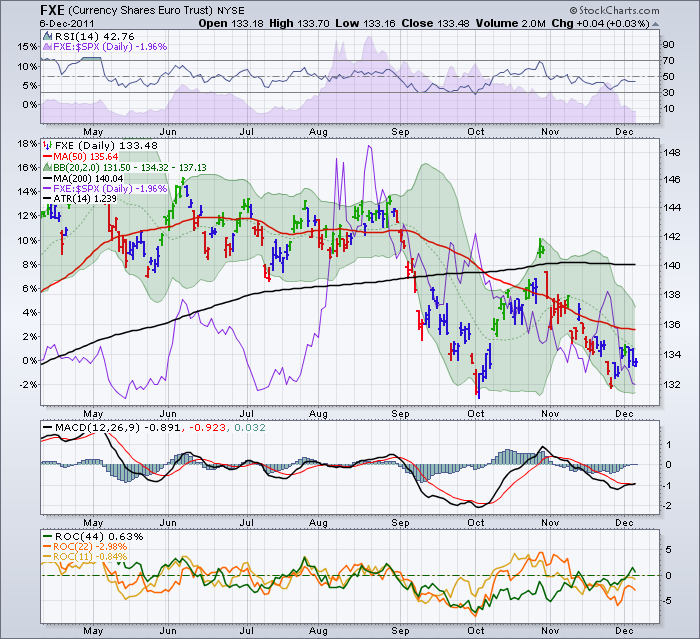
Here is the Euro. No Progress here either. If anything, that lower low today was bearish for the Euro, which is positive for the $USD, Which hurts commodity prices and hurts US exporters. Look at how small the range was today.
I would suggest the Super Mario in Italy is helping. I think Super Mario is on the Nintendo screen that Mario must jump between the Parmesan cheese graters!
But the market is pretty uncomfortable here in my mind.Not a whole lot of people JUMPING in for the year end rally here, but they are not selling it off.
The financials have performed well for a week, but not as good today. Oil is stuck at $100. Gold has oscillated $50 either way with no headway...
Options expiration Friday so that might provide drama.
As an aside, I want to speak to one Canadian stock that we all have seen make a big run.
I have been a bull on LULU. Recently, the price action is very weak. I'll cover it in tomorrows blog, but be careful. This one looks like it is letting go long before Christmas. Check out the 2007 CROX chart. Notice the price position relative to the 50/200 day crossover. Then check RIM.TO. Pay particular attention to how the stock behaves as it crosses the 50 and 200 dmas. As well, how the stock behaves after the moving averages cross. This is a novel that has been written many times before. Darlings to dust. Will it be that bad? I don't know, but I'll let someone else find out.
See if you can see the problems in the chart. I'll do a drill down on it tomorrow.
Good Trading,
Greg Schnell, CMT

